[SHORT ONLY] Internal Bar Strength (IBS) Mean Reversion Strategy█ STRATEGY DESCRIPTION
The "Internal Bar Strength (IBS) Strategy" is a mean-reversion strategy designed to identify trading opportunities based on the closing price's position within the daily price range. It enters a short position when the IBS indicates overbought conditions and exits when the IBS reaches oversold levels. This strategy is Short-Only and was designed to be used on the Daily timeframe for Stocks and ETFs.
█ WHAT IS INTERNAL BAR STRENGTH (IBS)?
Internal Bar Strength (IBS) measures where the closing price falls within the high-low range of a bar. It is calculated as:
IBS = (Close - Low) / (High - Low)
- Low IBS (≤ 0.2) : Indicates the close is near the bar's low, suggesting oversold conditions.
- High IBS (≥ 0.8) : Indicates the close is near the bar's high, suggesting overbought conditions.
█ SIGNAL GENERATION
1. SHORT ENTRY
A Short Signal is triggered when:
The IBS value rises to or above the Upper Threshold (default: 0.9).
The Closing price is greater than the previous bars High (close>high ).
The signal occurs within the specified time window (between `Start Time` and `End Time`).
2. EXIT CONDITION
An exit Signal is generated when the IBS value drops to or below the Lower Threshold (default: 0.3). This prompts the strategy to exit the position.
█ ADDITIONAL SETTINGS
Upper Threshold: The IBS level at which the strategy enters trades. Default is 0.9.
Lower Threshold: The IBS level at which the strategy exits short positions. Default is 0.3.
Start Time and End Time: The time window during which the strategy is allowed to execute trades.
█ PERFORMANCE OVERVIEW
This strategy is designed for Stocks and ETFs markets and performs best when prices frequently revert to the mean.
The strategy can be optimized further using additional conditions such as using volume or volatility filters.
It is sensitive to extreme IBS values, which help identify potential reversals.
Backtesting results should be analyzed to optimize the Upper/Lower Thresholds for specific instruments and market conditions.
在腳本中搜尋"high low"

IU Opening range Breakout StrategyIU Opening Range Breakout Strategy
This Pine Script strategy is designed to capitalize on the breakout of the opening range, which is a popular trading approach. The strategy identifies the high and low prices of the opening session and takes trades based on price crossing these levels, with built-in risk management and trade limits for intraday trading.
Key Features:
1. Risk Management:
- Risk-to-Reward Ratio (RTR):
Set a customizable risk-to-reward ratio to calculate target prices based on stop-loss levels.
Default: 2:1
- Max Trades in a Day:
Specify the maximum number of trades allowed per day to avoid overtrading.
Default: 2 trades in a day.
- End-of-Day Close:
Automatically closes all open positions at a user-defined session end time to ensure no overnight exposure.
Default: 3:15 PM
2. Opening Range Identification
- Opening Range High and Low:
The script detects the high and low of the first trading session using Pine Script's session functions.
These levels are plotted as visual guides on the chart:
- High: Lime-colored circles.
- Low: Red-colored circles.
3. Trade Entry Logic
- Long Entry:
A long trade is triggered when the price closes above the opening range high.
- Entry condition: Crossover of the price above the opening range high.
-Short Entry:
A short trade is triggered when the price closes below the opening range low.
- Entry condition: Crossunder of the price below the opening range low.
Both entries are conditional on the absence of an existing position.
4. Stop Loss and Take Profit
- Long Position:
- Stop Loss: Previous candle's low.
- Take Profit: Calculated based on the RTR.
- **Short Position:**
- **Stop Loss:** Previous candle's high.
- **Take Profit:** Calculated based on the RTR.
The strategy plots these levels for visual reference:
- Stop Loss: Red dashed lines.
- Take Profit: Green dashed lines.
5. Visual Enhancements
-Trade Level Highlighting:
The script dynamically shades the areas between the entry price and SL/TP levels:
- Red shading for the stop-loss region.
- Green shading for the take-profit region.
- Entry Price Line:
A silver-colored line marks the average entry price for active trades.
How to Use:
1.Input Configuration:
Adjust the Risk-to-Reward ratio, max trades per day, and session end time to suit your trading preferences.
2.Visual Cues:
Use the opening range high/low lines and shading to identify potential breakout opportunities.
3.Execution:
The strategy will automatically enter and exit trades based on the conditions. Review the plotted SL and TP levels to monitor the risk-reward setup.
Important Notes:
- This strategy is designed for intraday trading and works best in markets with high volatility during the opening session.
- Backtest the strategy on your preferred market and timeframe to ensure compatibility.
- Proper risk management and position sizing are essential when using this strategy in live markets.

MultiLayer Awesome Oscillator Saucer Strategy [Skyrexio]Overview
MultiLayer Awesome Oscillator Saucer Strategy leverages the combination of Awesome Oscillator (AO), Williams Alligator, Williams Fractals and Exponential Moving Average (EMA) to obtain the high probability long setups. Moreover, strategy uses multi trades system, adding funds to long position if it considered that current trend has likely became stronger. Awesome Oscillator is used for creating signals, while Alligator and Fractal are used in conjunction as an approximation of short-term trend to filter them. At the same time EMA (default EMA's period = 100) is used as high probability long-term trend filter to open long trades only if it considers current price action as an uptrend. More information in "Methodology" and "Justification of Methodology" paragraphs. The strategy opens only long trades.
Unique Features
No fixed stop-loss and take profit: Instead of fixed stop-loss level strategy utilizes technical condition obtained by Fractals and Alligator to identify when current uptrend is likely to be over (more information in "Methodology" and "Justification of Methodology" paragraphs)
Configurable Trading Periods: Users can tailor the strategy to specific market windows, adapting to different market conditions.
Multilayer trades opening system: strategy uses only 10% of capital in every trade and open up to 5 trades at the same time if script consider current trend as strong one.
Short and long term trend trade filters: strategy uses EMA as high probability long-term trend filter and Alligator and Fractal combination as a short-term one.
Methodology
The strategy opens long trade when the following price met the conditions:
1. Price closed above EMA (by default, period = 100). Crossover is not obligatory.
2. Combination of Alligator and Williams Fractals shall consider current trend as an upward (all details in "Justification of Methodology" paragraph)
3. Awesome Oscillator shall create the "Saucer" long signal (all details in "Justification of Methodology" paragraph). Buy stop order is placed one tick above the candle's high of last created "Saucer signal".
4. If price reaches the order price, long position is opened with 10% of capital.
5. If currently we have opened position and price creates and hit the order price of another one "Saucer" signal another one long position will be added to the previous with another one 10% of capital. Strategy allows to open up to 5 long trades simultaneously.
6. If combination of Alligator and Williams Fractals shall consider current trend has been changed from up to downtrend, all long trades will be closed, no matter how many trades has been opened.
Script also has additional visuals. If second long trade has been opened simultaneously the Alligator's teeth line is plotted with the green color. Also for every trade in a row from 2 to 5 the label "Buy More" is also plotted just below the teeth line. With every next simultaneously opened trade the green color of the space between teeth and price became less transparent.
Strategy settings
In the inputs window user can setup strategy setting: EMA Length (by default = 100, period of EMA, used for long-term trend filtering EMA calculation). User can choose the optimal parameters during backtesting on certain price chart.
Justification of Methodology
Let's go through all concepts used in this strategy to understand how they works together. Let's start from the easies one, the EMA. Let's briefly explain what is EMA. The Exponential Moving Average (EMA) is a type of moving average that gives more weight to recent prices, making it more responsive to current price changes compared to the Simple Moving Average (SMA). It is commonly used in technical analysis to identify trends and generate buy or sell signals. It can be calculated with the following steps:
1.Calculate the Smoothing Multiplier:
Multiplier = 2 / (n + 1), Where n is the number of periods.
2. EMA Calculation
EMA = (Current Price) × Multiplier + (Previous EMA) × (1 − Multiplier)
In this strategy uses EMA an initial long term trend filter. It allows to open long trades only if price close above EMA (by default 50 period). It increases the probability of taking long trades only in the direction of the trend.
Let's go to the next, short-term trend filter which consists of Alligator and Fractals. Let's briefly explain what do these indicators means. The Williams Alligator, developed by Bill Williams, is a technical indicator designed to spot trends and potential market reversals. It uses three smoothed moving averages, referred to as the jaw, teeth, and lips:
Jaw (Blue Line): The slowest of the three, based on a 13-period smoothed moving average shifted 8 bars ahead.
Teeth (Red Line): The medium-speed line, derived from an 8-period smoothed moving average shifted 5 bars forward.
Lips (Green Line): The fastest line, calculated using a 5-period smoothed moving average shifted 3 bars forward.
When these lines diverge and are properly aligned, the "alligator" is considered "awake," signaling a strong trend. Conversely, when the lines overlap or intertwine, the "alligator" is "asleep," indicating a range-bound or sideways market. This indicator assists traders in identifying when to act on or avoid trades.
The Williams Fractals, another tool introduced by Bill Williams, are used to pinpoint potential reversal points on a price chart. A fractal forms when there are at least five consecutive bars, with the middle bar displaying the highest high (for an up fractal) or the lowest low (for a down fractal), relative to the two bars on either side.
Key Points:
Up Fractal: Occurs when the middle bar has a higher high than the two preceding and two following bars, suggesting a potential downward reversal.
Down Fractal: Happens when the middle bar shows a lower low than the surrounding two bars, hinting at a possible upward reversal.
Traders often combine fractals with other indicators to confirm trends or reversals, improving the accuracy of trading decisions.
How we use their combination in this strategy? Let’s consider an uptrend example. A breakout above an up fractal can be interpreted as a bullish signal, indicating a high likelihood that an uptrend is beginning. Here's the reasoning: an up fractal represents a potential shift in market behavior. When the fractal forms, it reflects a pullback caused by traders selling, creating a temporary high. However, if the price manages to return to that fractal’s high and break through it, it suggests the market has "changed its mind" and a bullish trend is likely emerging.
The moment of the breakout marks the potential transition to an uptrend. It’s crucial to note that this breakout must occur above the Alligator's teeth line. If it happens below, the breakout isn’t valid, and the downtrend may still persist. The same logic applies inversely for down fractals in a downtrend scenario.
So, if last up fractal breakout was higher, than Alligator's teeth and it happened after last down fractal breakdown below teeth, algorithm considered current trend as an uptrend. During this uptrend long trades can be opened if signal was flashed. If during the uptrend price breaks down the down fractal below teeth line, strategy considered that uptrend is finished with the high probability and strategy closes all current long trades. This combination is used as a short term trend filter increasing the probability of opening profitable long trades in addition to EMA filter, described above.
Now let's talk about Awesome Oscillator's "Sauser" signals. Briefly explain what is the Awesome Oscillator. The Awesome Oscillator (AO), created by Bill Williams, is a momentum-based indicator that evaluates market momentum by comparing recent price activity to a broader historical context. It assists traders in identifying potential trend reversals and gauging trend strength.
AO = SMA5(Median Price) − SMA34(Median Price)
where:
Median Price = (High + Low) / 2
SMA5 = 5-period Simple Moving Average of the Median Price
SMA 34 = 34-period Simple Moving Average of the Median Price
Now we know what is AO, but what is the "Saucer" signal? This concept was introduced by Bill Williams, let's briefly explain it and how it's used by this strategy. Initially, this type of signal is a combination of the following AO bars: we need 3 bars in a row, the first one shall be higher than the second, the third bar also shall be higher, than second. All three bars shall be above the zero line of AO. The price bar, which corresponds to third "saucer's" bar is our signal bar. Strategy places buy stop order one tick above the price bar which corresponds to signal bar.
After that we can have the following scenarios.
Price hit the order on the next candle in this case strategy opened long with this price.
Price doesn't hit the order price, the next candle set lower low. If current AO bar is increasing buy stop order changes by the script to the high of this new bar plus one tick. This procedure repeats until price finally hit buy order or current AO bar become decreasing. In the second case buy order cancelled and strategy wait for the next "Saucer" signal.
If long trades has been opened strategy use all the next signals until number of trades doesn't exceed 5. All trades are closed when the trend changes to downtrend according to combination of Alligator and Fractals described above.
Why we use "Saucer" signals? If AO above the zero line there is a high probability that price now is in uptrend if we take into account our two trend filters. When we see the decreasing bars on AO and it's above zero it's likely can be considered as a pullback on the uptrend. When we see the stop of AO decreasing and the first increasing bar has been printed there is a high probability that this local pull back is finished and strategy open long trade in the likely direction of a main trend.
Why strategy use only 10% per signal? Sometimes we can see the false signals which appears on sideways. Not risking that much script use only 10% per signal. If the first long trade has been open and price continue going up and our trend approximation by Alligator and Fractals is uptrend, strategy add another one 10% of capital to every next saucer signal while number of active trades no more than 5. This capital allocation allows to take part in long trades when current uptrend is likely to be strong and use only 10% of capital when there is a high probability of sideways.
Backtest Results
Operating window: Date range of backtests is 2023.01.01 - 2024.11.25. It is chosen to let the strategy to close all opened positions.
Commission and Slippage: Includes a standard Binance commission of 0.1% and accounts for possible slippage over 5 ticks.
Initial capital: 10000 USDT
Percent of capital used in every trade: 10%
Maximum Single Position Loss: -5.10%
Maximum Single Profit: +22.80%
Net Profit: +2838.58 USDT (+28.39%)
Total Trades: 107 (42.99% win rate)
Profit Factor: 3.364
Maximum Accumulated Loss: 373.43 USDT (-2.98%)
Average Profit per Trade: 26.53 USDT (+2.40%)
Average Trade Duration: 78 hours
These results are obtained with realistic parameters representing trading conditions observed at major exchanges such as Binance and with realistic trading portfolio usage parameters.
How to Use
Add the script to favorites for easy access.
Apply to the desired timeframe and chart (optimal performance observed on 3h BTC/USDT).
Configure settings using the dropdown choice list in the built-in menu.
Set up alerts to automate strategy positions through web hook with the text: {{strategy.order.alert_message}}
Disclaimer:
Educational and informational tool reflecting Skyrex commitment to informed trading. Past performance does not guarantee future results. Test strategies in a simulated environment before live implementation

Candle Range Theory [Advanced] - AlgoVisionUnderstanding Candle Range Theory (CRT) in the AlgoVision Indicator
Candle Range Theory (CRT) is a structured approach to analyzing market movements within the price ranges of candlesticks. CRT is founded on the idea that each candlestick on a chart, regardless of timeframe, represents a distinct range of price action, marked by the candle's open, high, low, and close. This range gives insights into market dynamics, and when analyzed in lower timeframes, reveals patterns that indicate underlying market sentiment and institutional behaviors.
Key Concepts of Candle Range Theory
Candlestick Range: The range of a candlestick is simply the distance between its high and low. Across timeframes, this range highlights significant price behavior, with each candlestick representing a snapshot of price movement. The body (distance between open and close) shows the primary price action, while wicks (shadows) reflect price fluctuations or "noise" around this movement.
Multi-Timeframe Analysis: A higher-timeframe (HTF) candlestick can be dissected into smaller, structured price movements in lower timeframes (LTFs). By analyzing these smaller movements, traders gain a detailed view of the market’s progression within the HTF candlestick’s range. Each HTF candlestick’s high and low provide support and resistance levels on the LTF, where the price can "sweep," break out, or retest these levels.
Market Behavior within the Range: Price action within a range doesn’t move randomly; it follows structured behavior, often revealing patterns. By analyzing these patterns, CRT provides insights into the market’s intention to accumulate, manipulate, or distribute assets within these ranges. This behavior can indicate future market direction and increase the probability of accurate trading signals.
CRT and ICT Power of 3: Accumulation, Manipulation, and Distribution (AMD)
A foundational element of our CRT indicator is its combination with ICT’s Power of 3 (Accumulation, Manipulation, and Distribution or AMD). This approach identifies three stages of market movement:
Accumulation: During this phase, institutions accumulate positions within a tight price range, often leading to sideways movement. Here, price consolidates as institutions carefully enter or exit positions, erasing traces of their intent from public view.
Manipulation: Institutions often use manipulation to create false breakouts, targeting retail traders who enter the market on perceived breakouts or reversals. Manipulation is characterized by liquidity grabs, false breakouts, or stop hunts, as price momentarily moves outside the established range before quickly returning.
Distribution: Following accumulation and manipulation, the distribution phase aligns with the true market direction. Institutions now allow the market to move with the trend, initiating a stronger and more sustained price movement that aligns with their intended position.
This AMD cycle is often observed across multiple timeframes, allowing traders to refine entries and exits by identifying accumulation, manipulation, and distribution phases on smaller timeframes within the range of a higher-timeframe candle. CRT views this cycle as the "heartbeat" of the market—a continuous loop of price movements. With our indicator, you can identify this cycle on your current timeframe, with the signal candle acting as the "manipulation" candle.
How to Use the Premium AlgoVision CRT Indicator
1. Indicator Display Options
Bullish/Bearish Plot Indication: Toggles the display of bullish or bearish CRT signals. Turn this on to display signals on your chart or off to reduce screen clutter.
Order Block Indication: Highlights the order block entry price, which is the preferred entry point for CRT trades.
Purge Time Indication: Shows when the low or high of Candle 1 is purged by Candle 2, helping to identify potential manipulation points.
2. Filter Options
Match Indicator Candle with Signal: Ensures that only bullish Candle 2s (for longs) or bearish Candle 2s (for shorts) are signaled. This filter helps eliminate signals where the candlestick’s direction does not align with the CRT model.
Take Profit Already Reached: When enabled, this filter removes CRT signals if take profit levels are reached within Candle 2. This helps focus on setups where there’s still room for price movement.
Midnight Price Filter: Filters signals based on midnight price levels:
Longs: Only signals if the order block entry price is below the midnight price.
Shorts: Only signals if the order block entry price is above the midnight price.
3. Entry and Exit Settings
Wick out prevention: Allows positions to stay open and prevent getting wicked out. Positions will still be able to close if determined by the algorithm.
Buy/Sell: This allows you to set you daily bias. You can select to only see buys or sells.
Custom Stop Loss: Sets a custom stop loss distance from the entry price (e.g., $100 or $200 away) if the predefined stop loss based on Candle 2’s low/high doesn’t suit your preference.
Take Profit Levels: Choose from three take profit levels:
Optimized Take Profit: Uses an optimized take profit level based on CRT’s recommended exit point.
Take Profit 1: Sets an initial take profit level.
Take Profit 2: Sets a secondary take profit level for a more extended exit target.
Timeframe of Order Block: Select the timeframe of the order block entry, which can be tailored based on the timeframe of the CRT signal.
Risk-to-Reward Filter: Filters trades based on a specified risk-to-reward ratio, using the indicator’s stop loss as the base. This helps to ensure trades meet minimum reward criteria.
4. Risk Management
Fixed Entry QTY: This will allow you to open all positions with a fixed QTY
Risk to Reward Ratio: This allows you to set a minimum risk to reward ratio, the strategy will only take trades if this risk to reward is met.
Risk Type:
Fixed Amount: Allows you to risk a fixed $ amount.
% of account: Allows you to risk % of account equity.
5. Day and Time Filters
Filter by Days: Specify the days of the week for CRT signals to appear. For instance, you could enable signals only on Thursdays. This setting can be adjusted to any day or combination of days.
Purge Time Filter: Filters CRT signals based on specific purge times when Candle 1’s low/high is breached by Candle 2, as CRT setups are observed to work best during certain times.
Hour Filters for CRT Signals:
1-Hour CRT Times: Allows filtering CRT signals based on specific 1-hour time intervals.
4-Hour CRT Times: Filter 4-hour CRT signals based on specified times.
Forex and Futures Conversion: Adjusts times based on standard sessions for Forex (e.g., 9:00 AM 4-hour candle) and Futures (e.g., 10 PM candle for Futures or 8 AM for Crypto).
6. Currency and Asset-Specific Filters
Crypto vs. Forex Mode: This setting adjusts the indicator’s timing to match market sessions specific to either crypto or Forex/Futures, ensuring the CRT model aligns with the asset type.
Additional Notes
Backtesting Options: Adjust these to test risk management, such as risking a fixed amount or a percentage of the account, for historical performance insights.
Optimized Settings: This version includes all features and optimized settings, with the most refined data analysis.
Conclusion By combining CRT with ICT Power of 3, the AlgoVision Indicator allows traders to leverage the CRT candlestick as a versatile tool for identifying potential market moves. This method provides beginners and seasoned traders alike with a robust framework to understand market dynamics and refine trade strategies across timeframes. Setting alerts on the higher timeframe to catch bullish or bearish CRT signals allows you to plan and execute trades on the lower timeframe, aligning your strategy with the broader market flow.

The Flash-Strategy with Minervini Stage Analysis QualifierThe Flash-Strategy (Momentum-RSI, EMA-crossover, ATR) with Minervini Stage Analysis Qualifier
Introduction
Welcome to a comprehensive guide on a cutting-edge trading strategy I've developed, designed for the modern trader seeking an edge in today's dynamic markets. This strategy, which I've honed through my years of experience in the trading arena, stands out for its unique blend of technical analysis and market intuition, tailored specifically for use on the TradingView platform.
As a trader with a deep passion for the financial markets, my journey began several years ago, driven by a relentless pursuit of a trading methodology that is both effective and adaptable. My background in trading spans various market conditions and asset classes, providing me with a rich tapestry of experiences from which to draw. This strategy is the culmination of that journey, embodying the lessons learned and insights gained along the way.
The cornerstone of this strategy lies in its ability to generate precise long signals in a Stage 2 uptrend and equally accurate short signals in a Stage 4 downtrend. This approach is rooted in the principles of trend following and momentum trading, harnessing the power of key indicators such as the Momentum-RSI, EMA Crossover, and Average True Range (ATR). What sets this strategy apart is its meticulous design, which allows it to adapt to the ever-changing market conditions, providing traders with a robust tool for navigating both bullish and bearish scenarios.
This strategy was born out of a desire to create a trading system that is not only highly effective in identifying potential trade setups but also straightforward enough to be implemented by traders of varying skill levels. It's a reflection of my belief that successful trading hinges on clarity, precision, and disciplined execution. Whether you are a seasoned trader or just beginning your journey, this guide aims to provide you with a comprehensive understanding of how to harness the full potential of this strategy in your trading endeavors.
In the following sections, we will delve deeper into the mechanics of the strategy, its implementation, and how to make the most out of its features. Join me as we explore the nuances of a strategy that is designed to elevate your trading to the next level.
Stage-Specific Signal Generation
A distinctive feature of this trading strategy is its focus on generating long signals exclusively during Stage 2 uptrends and short signals during Stage 4 downtrends. This approach is based on the widely recognized market cycle theory, which divides the market into four stages: Stage 1 (accumulation), Stage 2 (uptrend), Stage 3 (distribution), and Stage 4 (downtrend). By aligning the signal generation with these specific stages, the strategy aims to capitalize on the most dynamic and clear-cut market movements, thereby enhancing the potential for profitable trades.
1. Long Signals in Stage 2 Uptrends
• Characteristics of Stage 2: Stage 2 is characterized by a strong uptrend, where prices are consistently rising. This stage typically follows a period of accumulation (Stage 1) and is marked by increased investor interest and bullish sentiment in the market.
• Criteria for Long Signal Generation: Long signals are generated during this stage when the technical indicators align with the characteristics of a Stage 2 uptrend.
• Rationale for Stage-Specific Signals: By focusing on Stage 2 for long trades, the strategy seeks to enter positions during the phase of strong upward momentum, thus riding the wave of rising prices and investor optimism. This stage-specific approach minimizes exposure to less predictable market phases, like the consolidation in Stage 1 or the indecision in Stage 3.
2. Short Signals in Stage 4 Downtrends
• Characteristics of Stage 4: Stage 4 is identified by a pronounced downtrend, with declining prices indicating prevailing bearish sentiment. This stage typically follows the distribution phase (Stage 3) and is characterized by increasing selling pressure.
• Criteria for Short Signal Generation: Short signals are generated in this stage when the indicators reflect a strong bearish trend.
• Rationale for Stage-Specific Signals: Targeting Stage 4 for shorting capitalizes on the market's downward momentum. This tactic aligns with the natural market cycle, allowing traders to exploit the downward price movements effectively. By doing so, the strategy avoids the potential pitfalls of shorting during the early or late stages of the market cycle, where trends are less defined and more susceptible to reversals.
In conclusion, the strategy’s emphasis on stage-specific signal generation is a testament to its sophisticated understanding of market dynamics. By tailoring the long and short signals to Stages 2 and 4, respectively, it leverages the most compelling phases of the market cycle, offering traders a clear and structured approach to aligning their trades with dominant market trends.
Strategy Overview
At the heart of this trading strategy is a philosophy centered around capturing market momentum and trend efficiency. The core objective is to identify and capitalize on clear uptrends and downtrends, thereby allowing traders to position themselves in sync with the market's prevailing direction. This approach is grounded in the belief that aligning trades with these dominant market forces can lead to more consistent and profitable outcomes.
The strategy is built on three foundational components, each playing a critical role in the decision-making process:
1. Momentum-RSI (Relative Strength Index): The Momentum-RSI is a pivotal element of this strategy. It's an enhanced version of the traditional RSI, fine-tuned to better capture the strength and velocity of market trends. By measuring the speed and change of price movements, the Momentum-RSI provides invaluable insights into whether a market is potentially overbought or oversold, suggesting possible entry and exit points. This indicator is especially effective in filtering out noise and focusing on substantial market moves.
2. EMA (Exponential Moving Average) Crossover: The EMA Crossover is a crucial component for trend identification. This strategy employs two EMAs with different timeframes to determine the market trend. When the shorter-term EMA crosses above the longer-term EMA, it signals an emerging uptrend, suggesting a potential long entry. Conversely, a crossover below indicates a possible downtrend, hinting at a short entry opportunity. This simple yet powerful tool is key in confirming trend directions and timing market entries.
3. ATR (Average True Range): The ATR is instrumental in assessing market volatility. This indicator helps in understanding the average range of price movements over a given period, thus providing a sense of how much a market might move on a typical day. In this strategy, the ATR is used to adjust stop-loss levels and to gauge the potential risk and reward of trades. It allows for more informed decisions by aligning trade management techniques with the current volatility conditions.
The synergy of these three components – the Momentum-RSI, EMA Crossover, and ATR – creates a robust framework for this trading strategy. By combining momentum analysis, trend identification, and volatility assessment, the strategy offers a comprehensive approach to navigating the markets. Whether it's capturing a strong trend in its early stages or identifying a potential reversal, this strategy aims to provide traders with the tools and insights needed to make well-informed, strategically sound trading decisions.
Detailed Component Analysis
The efficacy of this trading strategy hinges on the synergistic functioning of its three key components: the Momentum-RSI, EMA Crossover, and Average True Range (ATR). Each component brings a unique perspective to the strategy, contributing to a well-rounded approach to market analysis.
1. Momentum-RSI (Relative Strength Index)
• Definition and Function: The Momentum-RSI is a modified version of the classic Relative Strength Index. While the traditional RSI measures the velocity and magnitude of directional price movements, the Momentum-RSI amplifies aspects that reflect trend strength and momentum.
• Significance in Identifying Trend Strength: This indicator excels in identifying the strength behind a market's move. A high Momentum-RSI value typically indicates strong bullish momentum, suggesting the potential continuation of an uptrend. Conversely, a low Momentum-RSI value signals strong bearish momentum, possibly indicative of an ongoing downtrend.
• Application in Strategy: In this strategy, the Momentum-RSI is used to gauge the underlying strength of market trends. It helps in filtering out minor fluctuations and focusing on significant movements, providing a clearer picture of the market's true momentum.
2. EMA (Exponential Moving Average) Crossover
• Definition and Function: The EMA Crossover component utilizes two exponential moving averages of different timeframes. Unlike simple moving averages, EMAs give more weight to recent prices, making them more responsive to new information.
• Contribution to Market Direction: The interaction between the short-term and long-term EMAs is key to determining market direction. A crossover of the shorter EMA above the longer EMA is an indicator of an emerging uptrend, while a crossover below signals a developing downtrend.
• Application in Strategy: The EMA Crossover serves as a trend confirmation tool. It provides a clear, visual representation of the market's direction, aiding in the decision-making process for entering long or short positions. This component ensures that trades are aligned with the prevailing market trend, a crucial factor for the success of the strategy.
3. ATR (Average True Range)
• Definition and Function: The ATR is an indicator that measures market volatility by calculating the average range between the high and low prices over a specified period.
• Role in Assessing Market Volatility: The ATR provides insights into the typical market movement within a given timeframe, offering a measure of the market's volatility. Higher ATR values indicate increased volatility, while lower values suggest a calmer market environment.
• Application in Strategy: Within this strategy, the ATR is instrumental in tailoring risk management techniques, particularly in setting stop-loss levels. By accounting for the market's volatility, the ATR ensures that stop-loss orders are placed at levels that are neither too tight (risking premature exits) nor too loose (exposing to excessive risk).
In summary, the combination of Momentum-RSI, EMA Crossover, and ATR in this trading strategy provides a comprehensive toolkit for market analysis. The Momentum-RSI identifies the strength of market trends, the EMA Crossover confirms the market direction, and the ATR guides in risk management by assessing volatility. Together, these components form the backbone of a strategy designed to navigate the complexities of the financial markets effectively.
1. Signal Generation Process
• Combining Indicators: The strategy operates by synthesizing signals from the Momentum-RSI, EMA Crossover, and ATR indicators. Each indicator serves a specific purpose: the Momentum-RSI gauges trend momentum, the EMA Crossover identifies the trend direction, and the ATR assesses the market’s volatility.
• Criteria for Signal Validation: For a signal to be considered valid, it must meet specific criteria set by each of the three indicators. This multi-layered approach ensures that signals are not only based on one aspect of market behavior but are a result of a comprehensive analysis.
2. Conditions for Long Positions
• Uptrend Confirmation: A long position signal is generated when the shorter-term EMA crosses above the longer-term EMA, indicating an uptrend.
• Momentum-RSI Alignment: Alongside the EMA crossover, the Momentum-RSI should indicate strong bullish momentum. This is typically represented by the Momentum-RSI being at a high level, confirming the strength of the uptrend.
• ATR Consideration: The ATR is used to fine-tune the entry point and set an appropriate stop-loss level. In a low volatility scenario, as indicated by the ATR, the stop-loss can be set tighter, closer to the entry point.
3. Conditions for Short Positions
• Downtrend Confirmation: Conversely, a short position signal is indicated when the shorter-term EMA crosses below the longer-term EMA, signaling a downtrend.
• Momentum-RSI Confirmation: The Momentum-RSI should reflect strong bearish momentum, usually seen when the Momentum-RSI is at a low level. This confirms the bearish strength of the market.
• ATR Application: The ATR again plays a role in determining the stop-loss level for the short position. Higher volatility, as indicated by a higher ATR, would warrant a wider stop-loss to accommodate larger market swings.
By adhering to these mechanics, the strategy aims to ensure that each trade is entered with a high probability of success, aligning with the market’s current momentum and trend. The integration of these indicators allows for a holistic market analysis, providing traders with clear and actionable signals for both entering and exiting trades.
Customizable Parameters in the Strategy
Flexibility and adaptability are key features of this trading strategy, achieved through a range of customizable parameters. These parameters allow traders to tailor the strategy to their individual trading style, risk tolerance, and specific market conditions. By adjusting these parameters, users can fine-tune the strategy to optimize its performance and align it with their unique trading objectives. Below are the primary parameters that can be customized within the strategy:
1. Momentum-RSI Settings
• Period: The lookback period for the Momentum-RSI can be adjusted. A shorter period makes the indicator more sensitive to recent price changes, while a longer period smoothens the RSI line, offering a broader view of the momentum.
• Overbought/Oversold Thresholds: Users can set their own overbought and oversold levels, which can help in identifying extreme market conditions more precisely according to their trading approach.
2. EMA Crossover Settings
• Timeframes for EMAs: The strategy uses two EMAs with different timeframes. Traders can modify these timeframes, choosing shorter periods for a more responsive approach or longer periods for a more conservative one.
• Source Data: The choice of price data (close, open, high, low) used in calculating the EMAs can be varied depending on the trader’s preference.
3. ATR Settings
• Lookback Period: Adjusting the lookback period for the ATR impacts how the indicator measures volatility. A longer period may provide a more stable but less responsive measure, while a shorter period offers quicker but potentially more erratic readings.
• Multiplier for Stop-Loss Calculation: This parameter allows traders to set how aggressively or conservatively they want their stop-loss to be in relation to the ATR value.
Here are the standard settings:

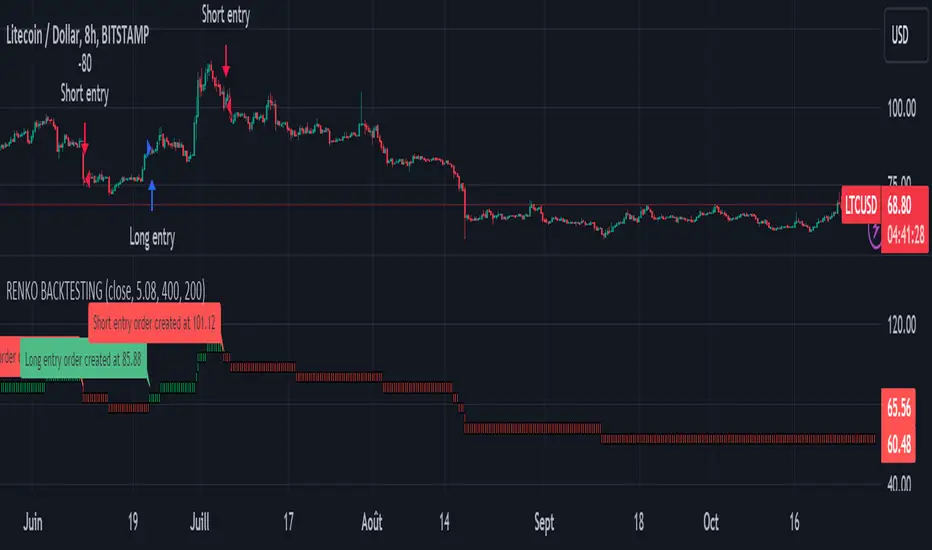
Renko StrategyRENKO STRATEGY
CAUTION : This strategy must be applied to a candlestick chart (not a Renko chart).
INTRODUCTION :
The Traditional Renko chart has been reproduced and is plotted according to the evolution of the price. It will enable us to receive buy or sell signals and follow major trends. This is a medium/long term strategy and depends a lot on the box size chosen in the parameters. There's also a money management method allowing us to reinvest part of the profits or reduce the size of orders in the event of substantial losses.
RENKO CHART :
Renko chart construction methodology :
The user must first choose the box size. The minimum is 0.00001 and there is no maximum. The default is 10. The user must then choose the source that will define the data on which the calculations will be based (high, low, open, close). By default, close is selected. The first candle on the chart is used to draw the first box with its high and low.
Each time the price changes by the amount of the box size relative to the high or low of the last box, a new box is added above or below the previous one. If price variations are less than the box size, the same box is added next to the previous one. If price variations are N (integer number) times greater than box size, N boxes are added above or below the previous one. Each box added above the previous one is a green box, while each box added below the previous one is a red box.
Conditions for drawing a green box above the previous one :
(source - high_of_the_last_box) / box_size > 1
Condition for drawing a red box below the previous one :
(low_of_the_last_box - source) / box_size > 1
If neither condition is triggered, the same box is drawn next to the previous one.
Example :
The last candle has drawn a box with low 12 and high 14. The box size is therefore 2. The strategy will look at the value of the close each time a candle ends. The current candle closes with a close equal to 15.5. As the variation from the previous high is only 1.5 (which is less than the box size), the same box is added next to the previous one. The next candle closes at 16.2. The price variation is therefore 2.2 compared with the previous high. We can now add a new green box just above the previous one, with a low of 14 and a high of 16. The same process applies if the candle's close is at least one box size below the low of the last box. In this case, a new red box is placed below the previous one.
PARAMETERS :
Source : Allows you to specify which data will be taken into account by the strategy when performing calculations. The default is close.
Box size : Size of Renko graph boxes. This is a very important parameter to choose carefully, as it has a strong impact on the strategy's performance. Defaults to 10.
Fixed Ratio : This is the amount of gain or loss at which the order quantity is changed. The default is 400, meaning that for each $400 gain or loss, the order size is increased or decreased by a user-selected amount.
Increasing Order Amount : This is the amount to be added to or subtracted from orders when the fixed ratio is reached. The default is $200, which means that for every $400 gain, $200 is reinvested in the strategy. On the other hand, for every $400 loss, the order size is reduced by $200.
Initial capital : $1000
Fees : Interactive Broker fees apply to this strategy. They are set at 0.18% of the trade value.
Slippage : 3 ticks or $0.03 per trade. Corresponds to the latency time between the moment the signal is received and the moment the order is executed by the broker.
Important : A bot has been used to test all possible box sizes to find out which one generates the highest return on BITSTAMP:LTCUSD while limiting the drawdown. This strategy is the most optimal with a box size equal to 5.08 in 8h timeframe.
BUY AND SHORT SIGNALS :
As the aim of this strategy is to follow major trends based on price movements, we need to be on the right side of price fluctuation. We trade every box reversal, i.e. we are LONG when the boxes are green indicating an uptrend and SHORT when they are red indicating a downtrend.
RISK MANAGEMENT :
This strategy can incur losses. The size of the box is decisive, as it is used to plot the RENKO chart and thus trigger buy or sell signals. It's also what allows us to manage risk. For every trade, we risk a maximum amount equal to 2 times the size of the box, i.e. :(5.08*2*nb_contract)/trade_value.
MONEY MANAGEMENT :
The fixed ratio method has been used to manage our gains and losses. For each gain of an amount equal to the value of the fixed ratio, we increase the order size by a value defined by the user in the "Increasing order amount" parameter. Similarly, each time we lose an amount equal to the value of the fixed ratio, we decrease the order size by the same user-defined value. This strategy not only increases our performance, but also our drawdown.
Enjoy the strategy and don't forget to take the trade :)
VXD SupercycleVXD is a brand new indicator and still developing. to minimize stop losses and overcome sideways market conditions, Higher Timeframe are recommended
Trend lines
-using Rolling VWAP as trend line to determined if Volume related to a certain price.
-you can switch RVWAP to EMA in the setting
ATR
-trailing 12*ATR and 2.4 Mutiplier
Pivot point and Rejected Block
Pivot show last High and low of a price in past bars
Rejected Block show when that High or Low price are important level to determined if it's Hidden Divergence or Divergence
Symbols on chart show Premium and Discount Prices
X-Cross - show potential reversal trend with weak volume .
O-circle - show potential reversal trend with strong volume .
Setting
Momentum: RSI = 25 , RSI MA = 14
Trend: Rolling VWAP and ATR and Subhag
Trailing STOP: ATR 12 x 2.4
Highlight Bars color when volume is above SMA 6
SMA200 act as TP Line
Risk:Reward Calculation
if Buy your Stoploss will be previous Pivot low
if Sell your Stoploss will be previous Pivot high and will be calculated form there, then show TP in Orange color line
VXD เป็นระบบเทรดที่ผมทดลองเอาหลาย ๆ ไอเดีย ทั้งจาก Youtube facebook และกลุ่มคนต่าง ๆ มารวบรวมไว้ แล้วตกผลึกขึ้นมาเป็นระบบนี้ ใน Timeframe ใหญ่ ๆ สามารถลากได้ทั้ง Cycle กันเลย
Trend lines
-ใช้ Rolling VWAP ของแอพ Tradingview (สามารถตั้งแค่าเป็น EMA ได้)
ATR
-ใช้ค่า ATR 12 Mutiplier 2.4
Pivot point and Rejected Block
Pivot โชว์เส้น High low และมีผลกับออเดอร์ หากแท่งเทียนปิดทะลุเส้นนี้
Rejected Block วาดแนวรับ-ต้าน อัตโนมัติ ใช้ประกอบ RSI ว่ามี Divergence หรือไม่
สัญลักษณ์ต่าง ๆ
X-Cross - แท่งกลืนกิน วอลุ่มน้อย
O-circle - แท่งกลืนกิน มีวอลุ่ม
Setting
Momentum: RSI = 25 , RSI MA = 14
Trend: Rolling VWAP and ATR and Subhag
Trailing STOP: ATR 12 x 2.4
Highlight Bars color when volume is above SMA 6
SMA200 act as TP Line
Risk:Reward Calculation
หาก Buy จุด SL จะอยู่ที่ Pivot low
หาก Sell จุด SL จะอยู่ที่ Pivot high และระบบจะคำนวณจากตรงนั้น จากนั้นแสดงเป็นเส้น TP สีส้ม
This Strategy Combined the following indicators and conditioning by me
ATR , RSI , EMA , SMA
Rolling VWAP - /script/ZU2UUu9T-Rolling-VWAP/
Regression Lines - Subhag form Subhag Ghosh /script/LHHBVpQu-Subhag-Ghosh-Algo-Version-for-banknifty/
Rejection Block , Pivots , High Volume Bars and PPDD form Super OrderBlock / FVG / BoS Tools by makuchaku & eFe /script/aZACDmTC-Super-OrderBlock-FVG-BoS-Tools-by-makuchaku-eFe/
ขอให้รวยครับ.

Strategy Template - V2This is an educational script created to demonstrate few basic building blocks of a trend based strategy and how to achieve different entry and exit types. My initial intention was to create a comprehensive strategy template which covers all the aspects of strategy. But, ended up creating fully fledged strategy based on trend following.
This is an enhancement on Strategy-Template But this script is comparitively more complex. Hence I decided to create new version instead of updating the existing one.
Lets dive deep.
SIMPLE COMPONENTS OF TREND FOLLOWING STRATEGY
TREND BIAS - This defines the direction of trend. Idea is not to trade against the trend direction. If the bias is bullish, look for long opportunities and if bias is bearish, look for short opportunities. Stay out of the market when the bias is neutral.
Often, trend bias is determined based on longer timeframe conditions. Example - 200 Moving Average, Higher timeframe moving averages, Higher timeframe high-lows etc. can be used for determining the trend bias.
In this script, I am using Weekly donchian channels combined with daily donchian channels to define trend bias.
Long Bias - 40 Day donchian channel sits completely in upper portion of 40 Week dochnial channel.
Short Bias - 40 Day donchian channel sits completely in lower portion of 40 Week donchian channel.
ENTRY CONDITION - Entry signals are generated only in the direction of bias. Hence, when in LongBias, we only get Long signals and when in short bias, we only get short signals.
In our case, when in Long Bias - if price hits 40 day high for the first time, this creates our long entry signal. Similarly when in Short Bias , price hitting 40 day low will create signal for going short. Since we do not take trades opposite to trend, no entry conditions are formed when price hits 40 day high in Short Bias or 40 day low in Long Bias.
EXIT CONDITION - Exit conditions are formed when we get signals of trend failure.
In our case, when in long trade, price hitting 40 day low creates exit signal. Similarly when in short trade price hitting 40 day high creates exit signal for short trade.
DIFFERENT TYPES OF ENTRY AND EXIT
In this script, I have tried to demonstrate different entry and exit types.
Entry types
Market - Enter immediately when entry signal is received. That is, in this case when price crossover over high in long bias and crosses under low in short bias
Stop - This method includes estimating at what level new highs are made and creating a stop buy order at that level. This way, we do not miss if the break out is stronger. But, susciptible to fail during fakeouts.
Limit - This method includes executing a limit order to buy at lower price or sell at higher price. In trend following methods, downside of limit order is when there is genuine breakout, these limit orders may not hit and during trend failures the limit orders are likely to hit and go straight to stop.
Stop-Limit - this is same as stop order but will also place a limit condition to avoid buying on overextended breakout or with lots of slippage.
Exit types
Market - whether to keep the existing trade running or whether to close it is determined after close of each bar and exit orders are executed manually upon receiving exit signal.
Stop - We place stop loss orders beforehand when there is a trade in place. This can help in avoiding big movements against trade within bar. But, this may also stop on false signals or fakeouts.
Take profit
Stop - No take profits are configured.
Target - 30% of the positions are closed when take profit levels are hit. Take profit levels are defined by risk reward.
USING THE CODE AS TEMPLATE
As mentioned earlier, I intended to create a fully fledged strategy template. But, ended up creating a fully fledged stratgy. However, you can take some part of this code and use it to start your own strategy. Will explain what all things can be adopted without worrying about the strategy implementation within
Strategy definition : This can be copied as is and just change the title of strategy. This defines some of the commonly used parameters of strategy which can help with close to realistic backtesting results for your coded strategy and comparison with buy and hold.
Generic Strategy Parameters : The parameter which defines controlling alllowed trade direction and trading window are present here. This again can be copied as is and variable inDateRange can be directly used in entry conditions.
Generic Methods : f_getMovingAverage and f_secureSecurity are handy and can be used as is. atr method provideded by pine gives you ATR based on RMA. If you want SMA or any other moving average based ATR, you can use the method f_getCustomAtr
Trade Statements : This section has all types of trading instructions which includes market/stop/limit/stop-limit type of entries and exits and take profit statements. You can adopt the type of entry you are interested in and change when condition to suit your strategy.
Trade conditions and levels : This section is required. But, cannot be copied. All the trade logic goes here which also sets parameters which are used in when of Trade Statements.
Hope this helps.

TrendMaAlignmentStrategy - Long term tradesThis is another strategy based on moving average alignment and HighLow periods. This is more suitable for long term trend traders and mainly for stocks.
Candle is colored lime if : Lookback Period has at least one bar with moving averages fully aligned OR None of the bars in Lookback periods has negatively aligned moving averages (More than half are positively aligned).
Candle is colored orange if : Lookback Period has at least one bar with moving averages fully aligned in negative way OR none of the bars in lookback has positively aligned moving averages (More than half are negatively aligned).
If either of above conditions are met, candle is colored silver.
Moving average alignment parameters:
Moving Average Type : MA Type for calculating Aligned Moving Average Index
Lookback Period : Lookback period to check highest and lowest Moving Average index.
HighLow parameters:
Short High/Low Period: Short period to check highs and lows
Long High/Low Period: Longer Period to check highs and lows.
If short period high == long period high, which means, instrument has made new high in the short period.
ATR Parameters:
ATR Length: ATR periods
StopMultiplyer: To set stop loss.
ReentryStopMultiplyer: This is used when signal is green buy stop loss on previous trade is hit. In such cases, new order will not be placed until it has certain distance from stop line.
Trade Prameters:
Exit on Signal : To be used with caution. Enabling it will allow us to get out on bad trades early and helps exit trades in long consolidation periods. But, this may also cause early exit in the trend. If instrument is trending nicely, it is better to keep this setting unchecked.
Trade direction : Default is long only. Short trades are not so successful in backtest. Use it with caution.
Backtest years : limit backtesting to certain years.
Part of the logic used from study's below:
Other strategies based on these two studies are below (which are meant for short - medium terms):

Session Opening Range Breakout (ORBO)This strategy automates a classic Opening Range Breakout (ORBO) approach: it builds a price range for the first minutes after the market opens, then looks for strong breakouts above or below that range to catch early directional moves.
Concept
The idea behind ORBO is simple:
The first minutes after the session open are often highly informative.
Price forms an “opening range” that acts as a mini support/resistance zone.
A clean breakout beyond this zone can lead to high-momentum moves.
This script turns that logic into a fully backtestable strategy in TradingView.
How the strategy works
Opening Range Session
Default session: 09:30–09:50 (exchange time)
During this window, the script tracks:
orHigh → highest high within the session
orLow → lowest low within the session
This forms your Opening Range for the day.
Breakout Logic (after the window ends)
Once the defined session ends:
Long Entry:
If the close crosses above the Opening Range High (orHigh),
→ strategy.entry("OR Long", strategy.long) is triggered.
Short Entry:
If the close crosses below the Opening Range Low (orLow),
→ strategy.entry("OR Short", strategy.short) is triggered.
Only one opening range per day is considered, which keeps the logic clean and easy to interpret.
Daily Reset
At the start of a new trading day, the script resets:
orHigh := na
orLow := na
A fresh Opening Range is then built using the next session’s 09:30–09:50 candles.
This ensures entries are always based on today’s structure, not yesterday’s.
Visuals & Inputs
Inputs:
Opening range session → default: "0930-0950"
Show OR levels → toggle visibility of OR High / Low lines
Fill range body → optional shaded zone between OR High and OR Low
Chart visuals:
A green line marks the Opening Range High.
A red line marks the Opening Range Low.
Optional yellow fill highlights the entire OR zone.
Background shading during the session shows when the range is currently being built.
These visuals make it easy to see:
Where the OR sits relative to current price
How clean / noisy the breakout was
How often price respects or rejects the opening zone
Backtesting & Optimization
Because this is written as a strategy():
You can use TradingView’s Strategy Tester to view:
Win rate
Net profit
Drawdown
Profit factor
Equity curve
Ideas to experiment with:
Change the session window (e.g., 09:15–09:45, 10:00–10:30)
Apply to different:
Markets: indices, FX, crypto, stocks
Timeframes: 1m / 5m / 15m
Add your own:
Stop Loss & Take Profit levels
Time filters (only trade certain days / times)
Volatility filters (e.g., ATR, range size thresholds)
Higher-timeframe trend filter (e.g., only take longs above 200 EMA)

RUSSFEST SMC Strategy V1.4RUSSFEST SMC Strategy V1.4 is a multi-timeframe Smart Money Concepts framework that builds a clean, rule-based view of market structure and then trades directly off that structure. It’s designed for traders who want to systematize SMC logic, keep their charts readable, and automate their trading.
Instead of relying on lagging oscillators, the strategy continuously tracks the active price leg, labels strong/weak highs and lows, and reacts to structural shifts in real time. The current timeframe leg is always drawn on your chart with a clear high, low, and midpoint, so you can instantly see whether price is trading in a discount or premium relative to the leg. Trade entries are driven by confirmed events aligned with directional bias, not by single-candle patterns.
A higher-timeframe (HTF) structure engine runs in the background and can be overlaid on your execution timeframe (e.g., 4H structure on a 15m chart). This HTF leg provides the primary bias and defines HTF discount/premium zones so that longs can be constrained to discounted areas of a bullish leg and shorts to premium areas of a bearish leg. An optional additional HTF bias can be turned on for traders who want an extra top-down filter before any position is allowed.
Risk management is fully structure-based. Stops are always placed beyond the current structure high/low with an optional buffer, so every trade is anchored to a meaningful swing point instead of arbitrary points. Take-profit logic is configurable:
Fixed RR – simple R-multiple targeting off the structure-based stop.
HTF Weak High/Low – targets the opposing side of the active HTF leg.
Opposite CHoCH – dynamically exits when structure flips against the position, effectively using the next structural shift as an exit rule.
Key Features:
Full SMC-style price leg tracking with strong/weak highs & lows and midpoint.
Multi-timeframe structure: overlay HTF leg on your LTF execution chart.
Primary and optional secondary HTF bias filters.
Discount/premium gating relative to the HTF leg (no “chasing” in the wrong zone).
Structure-anchored stop loss with three exit modes (Fixed RR, HTF target, Opposite CHoCH).
Day-of-week filters for filtering out any days that don't prove to be profitable.
This script is a structured SMC framework, not financial advice. Markets are risky; always forward-test, adjust parameters for your instrument and timeframe, and use position sizing that fits your own risk tolerance.

BOCS Channel Scalper Strategy - Automated Mean Reversion System# BOCS Channel Scalper Strategy - Automated Mean Reversion System
## WHAT THIS STRATEGY DOES:
This is an automated mean reversion trading strategy that identifies consolidation channels through volatility analysis and executes scalp trades when price enters entry zones near channel boundaries. Unlike breakout strategies, this system assumes price will revert to the channel mean, taking profits as price bounces back from extremes. Position sizing is fully customizable with three methods: fixed contracts, percentage of equity, or fixed dollar amount. Stop losses are placed just outside channel boundaries with take profits calculated either as fixed points or as a percentage of channel range.
## KEY DIFFERENCE FROM ORIGINAL BOCS:
**This strategy is designed for traders seeking higher trade frequency.** The original BOCS indicator trades breakouts OUTSIDE channels, waiting for price to escape consolidation before entering. This scalper version trades mean reversion INSIDE channels, entering when price reaches channel extremes and betting on a bounce back to center. The result is significantly more trading opportunities:
- **Original BOCS**: 1-3 signals per channel (only on breakout)
- **Scalper Version**: 5-15+ signals per channel (every touch of entry zones)
- **Trade Style**: Mean reversion vs trend following
- **Hold Time**: Seconds to minutes vs minutes to hours
- **Best Markets**: Ranging/choppy conditions vs trending breakouts
This makes the scalper ideal for active day traders who want continuous opportunities within consolidation zones rather than waiting for breakout confirmation. However, increased trade frequency also means higher commission costs and requires tighter risk management.
## TECHNICAL METHODOLOGY:
### Price Normalization Process:
The strategy normalizes price data to create consistent volatility measurements across different instruments and price levels. It calculates the highest high and lowest low over a user-defined lookback period (default 100 bars). Current close price is normalized using: (close - lowest_low) / (highest_high - lowest_low), producing values between 0 and 1 for standardized volatility analysis.
### Volatility Detection:
A 14-period standard deviation is applied to the normalized price series to measure price deviation from the mean. Higher standard deviation values indicate volatility expansion; lower values indicate consolidation. The strategy uses ta.highestbars() and ta.lowestbars() to identify when volatility peaks and troughs occur over the detection period (default 14 bars).
### Channel Formation Logic:
When volatility crosses from a high level to a low level (ta.crossover(upper, lower)), a consolidation phase begins. The strategy tracks the highest and lowest prices during this period, which become the channel boundaries. Minimum duration of 10+ bars is required to filter out brief volatility spikes. Channels are rendered as box objects with defined upper and lower boundaries, with colored zones indicating entry areas.
### Entry Signal Generation:
The strategy uses immediate touch-based entry logic. Entry zones are defined as a percentage from channel edges (default 20%):
- **Long Entry Zone**: Bottom 20% of channel (bottomBound + channelRange × 0.2)
- **Short Entry Zone**: Top 20% of channel (topBound - channelRange × 0.2)
Long signals trigger when candle low touches or enters the long entry zone. Short signals trigger when candle high touches or enters the short entry zone. This captures mean reversion opportunities as price reaches channel extremes.
### Cooldown Filter:
An optional cooldown period (measured in bars) prevents signal spam by enforcing minimum spacing between consecutive signals. If cooldown is set to 3 bars, no new long signal will fire until 3 bars after the previous long signal. Long and short cooldowns are tracked independently, allowing both directions to signal within the same period.
### ATR Volatility Filter:
The strategy includes a multi-timeframe ATR filter to avoid trading during low-volatility conditions. Using request.security(), it fetches ATR values from a specified timeframe (e.g., 1-minute ATR while trading on 5-minute charts). The filter compares current ATR to a user-defined minimum threshold:
- If ATR ≥ threshold: Trading enabled
- If ATR < threshold: No signals fire
This prevents entries during dead zones where mean reversion is unreliable due to insufficient price movement.
### Take Profit Calculation:
Two TP methods are available:
**Fixed Points Mode**:
- Long TP = Entry + (TP_Ticks × syminfo.mintick)
- Short TP = Entry - (TP_Ticks × syminfo.mintick)
**Channel Percentage Mode**:
- Long TP = Entry + (ChannelRange × TP_Percent)
- Short TP = Entry - (ChannelRange × TP_Percent)
Default 50% targets the channel midline, a natural mean reversion target. Larger percentages aim for opposite channel edge.
### Stop Loss Placement:
Stop losses are placed just outside the channel boundary by a user-defined tick offset:
- Long SL = ChannelBottom - (SL_Offset_Ticks × syminfo.mintick)
- Short SL = ChannelTop + (SL_Offset_Ticks × syminfo.mintick)
This logic assumes channel breaks invalidate the mean reversion thesis. If price breaks through, the range is no longer valid and position exits.
### Trade Execution Logic:
When entry conditions are met (price in zone, cooldown satisfied, ATR filter passed, no existing position):
1. Calculate entry price at zone boundary
2. Calculate TP and SL based on selected method
3. Execute strategy.entry() with calculated position size
4. Place strategy.exit() with TP limit and SL stop orders
5. Update info table with active trade details
The strategy enforces one position at a time by checking strategy.position_size == 0 before entry.
### Channel Breakout Management:
Channels are removed when price closes more than 10 ticks outside boundaries. This tolerance prevents premature channel deletion from minor breaks or wicks, allowing the mean reversion setup to persist through small boundary violations.
### Position Sizing System:
Three methods calculate position size:
**Fixed Contracts**:
- Uses exact contract quantity specified in settings
- Best for futures traders (e.g., "trade 2 NQ contracts")
**Percentage of Equity**:
- position_size = (strategy.equity × equity_pct / 100) / close
- Dynamically scales with account growth
**Cash Amount**:
- position_size = cash_amount / close
- Maintains consistent dollar exposure regardless of price
## INPUT PARAMETERS:
### Position Sizing:
- **Position Size Type**: Choose Fixed Contracts, % of Equity, or Cash Amount
- **Number of Contracts**: Fixed quantity per trade (1-1000)
- **% of Equity**: Percentage of account to allocate (1-100%)
- **Cash Amount**: Dollar value per position ($100+)
### Channel Settings:
- **Nested Channels**: Allow multiple overlapping channels vs single channel
- **Normalization Length**: Lookback for high/low calculation (1-500, default 100)
- **Box Detection Length**: Period for volatility detection (1-100, default 14)
### Scalping Settings:
- **Enable Long Scalps**: Toggle long entries on/off
- **Enable Short Scalps**: Toggle short entries on/off
- **Entry Zone % from Edge**: Size of entry zone (5-50%, default 20%)
- **SL Offset (Ticks)**: Distance beyond channel for stop (1+, default 5)
- **Cooldown Period (Bars)**: Minimum spacing between signals (0 = no cooldown)
### ATR Filter:
- **Enable ATR Filter**: Toggle volatility filter on/off
- **ATR Timeframe**: Source timeframe for ATR (1, 5, 15, 60 min, etc.)
- **ATR Length**: Smoothing period (1-100, default 14)
- **Min ATR Value**: Threshold for trade enablement (0.1+, default 10.0)
### Take Profit Settings:
- **TP Method**: Choose Fixed Points or % of Channel
- **TP Fixed (Ticks)**: Static distance in ticks (1+, default 30)
- **TP % of Channel**: Dynamic target as channel percentage (10-100%, default 50%)
### Appearance:
- **Show Entry Zones**: Toggle zone labels on channels
- **Show Info Table**: Display real-time strategy status
- **Table Position**: Corner placement (Top Left/Right, Bottom Left/Right)
- **Color Settings**: Customize long/short/TP/SL colors
## VISUAL INDICATORS:
- **Channel boxes** with semi-transparent fill showing consolidation zones
- **Colored entry zones** labeled "LONG ZONE ▲" and "SHORT ZONE ▼"
- **Entry signal arrows** below/above bars marking long/short entries
- **Active TP/SL lines** with emoji labels (⊕ Entry, 🎯 TP, 🛑 SL)
- **Info table** showing position status, channel state, last signal, entry/TP/SL prices, and ATR status
## HOW TO USE:
### For 1-3 Minute Scalping (NQ/ES):
- ATR Timeframe: "1" (1-minute)
- ATR Min Value: 10.0 (for NQ), adjust per instrument
- Entry Zone %: 20-25%
- TP Method: Fixed Points, 20-40 ticks
- SL Offset: 5-10 ticks
- Cooldown: 2-3 bars
- Position Size: 1-2 contracts
### For 5-15 Minute Day Trading:
- ATR Timeframe: "5" or match chart
- ATR Min Value: Adjust to instrument (test 8-15 for NQ)
- Entry Zone %: 20-30%
- TP Method: % of Channel, 40-60%
- SL Offset: 5-10 ticks
- Cooldown: 3-5 bars
- Position Size: Fixed contracts or 5-10% equity
### For 30-60 Minute Swing Scalping:
- ATR Timeframe: "15" or "30"
- ATR Min Value: Lower threshold for broader market
- Entry Zone %: 25-35%
- TP Method: % of Channel, 50-70%
- SL Offset: 10-15 ticks
- Cooldown: 5+ bars or disable
- Position Size: % of equity recommended
## BACKTEST CONSIDERATIONS:
- Strategy performs best in ranging, mean-reverting markets
- Strong trending markets produce more stop losses as price breaks channels
- ATR filter significantly reduces trade count but improves quality during low volatility
- Cooldown period trades signal quantity for signal quality
- Commission and slippage materially impact sub-5-minute timeframe performance
- Shorter timeframes require tighter entry zones (15-20%) to catch quick reversions
- % of Channel TP adapts better to varying channel sizes than fixed points
- Fixed contract sizing recommended for consistent risk per trade in futures
**Backtesting Parameters Used**: This strategy was developed and tested using realistic commission and slippage values to provide accurate performance expectations. Recommended settings: Commission of $1.40 per side (typical for NQ futures through discount brokers), slippage of 2 ticks to account for execution delays on fast-moving scalp entries. These values reflect real-world trading costs that active scalpers will encounter. Backtest results without proper cost simulation will significantly overstate profitability.
## COMPATIBLE MARKETS:
Works on any instrument with price data including stock indices (NQ, ES, YM, RTY), individual stocks, forex pairs (EUR/USD, GBP/USD), cryptocurrency (BTC, ETH), and commodities. Volume-based features require data feed with volume information but are optional for core functionality.
## KNOWN LIMITATIONS:
- Immediate touch entry can fire multiple times in choppy zones without adequate cooldown
- Channel deletion at 10-tick breaks may be too aggressive or lenient depending on instrument tick size
- ATR filter from lower timeframes requires higher-tier TradingView subscription (request.security limitation)
- Mean reversion logic fails in strong breakout scenarios leading to stop loss hits
- Position sizing via % of equity or cash amount calculates based on close price, may differ from actual fill price
- No partial closing capability - full position exits at TP or SL only
- Strategy does not account for gap openings or overnight holds
## RISK DISCLOSURE:
Trading involves substantial risk of loss. Past performance does not guarantee future results. This strategy is for educational purposes and backtesting only. Mean reversion strategies can experience extended drawdowns during trending markets. Stop losses may not fill at intended levels during extreme volatility or gaps. Thoroughly test on historical data and paper trade before risking real capital. Use appropriate position sizing and never risk more than you can afford to lose. Consider consulting a licensed financial advisor before making trading decisions. Automated trading systems can malfunction - monitor all live positions actively.
## ACKNOWLEDGMENT & CREDITS:
This strategy is built upon the channel detection methodology created by **AlgoAlpha** in the "Smart Money Breakout Channels" indicator. Full credit and appreciation to AlgoAlpha for pioneering the normalized volatility approach to identifying consolidation patterns. The core channel formation logic using normalized price standard deviation is AlgoAlpha's original contribution to the TradingView community.
Enhancements to the original concept include: mean reversion entry logic (vs breakout), immediate touch-based signals, multi-timeframe ATR volatility filtering, flexible position sizing (fixed/percentage/cash), cooldown period filtering, dual TP methods (fixed points vs channel percentage), automated strategy execution with exit management, and real-time position monitoring table.

Script_Algo - High Low Range MA Crossover Strategy🎯 Core Concept
This strategy uses modified moving averages crossover, built on maximum and minimum prices, to determine entry and exit points in the market. A key advantage of this strategy is that it avoids most false signals in trendless conditions, which is characteristic of traditional moving average crossover strategies. This makes it possible to improve the risk/reward ratio and, consequently, the strategy's profitability.
📊 How the Strategy Works
Main Mechanism
The strategy builds 4 moving averages:
Two senior MAs (on high and low) with a longer period
Two junior MAs (on high and low) with a shorter period
Buy signal 🟢: when the junior MA of lows crosses above the senior MA of highs
Sell signal 🔴: when the junior MA of highs crosses below the senior MA of lows
As seen on the chart, it was potentially possible to make 9X on the WIFUSDT cryptocurrency pair in just a year and a half. However, be careful—such results may not necessarily be repeated in the future.
Special Feature
Position closing priority ❗: if an opposite signal arrives while a position is open, the strategy first closes the current position and only then opens a new one
⚙️ Indicator Settings
Available Moving Average Types
EMA - Exponential MA
SMA - Simple MA
SSMA - Smoothed MA
WMA - Weighted MA
VWMA - Volume Weighted MA
RMA - Adaptive MA
DEMA - Double EMA
TEMA - Triple EMA
Adjustable Parameters
Senior MA Length - period for long-term moving averages
Junior MA Length - period for short-term moving averages
✅ Advantages of the Strategy
🛡️ False Signal Protection - using two pairs of modified MAs reduces the number of false entries
🔄 Configuration Flexibility - ability to choose MA type and calculation periods
⚡ Automatic Switching - the strategy automatically closes the current position when receiving an opposite signal
📈 Visual Clarity - all MAs are displayed on the chart in different colors
⚠️ Disadvantages and Risks
📉 Signal Lag - like all MA-based strategies, it may provide delayed signals during sharp movements
🔁 Frequent Switching - in sideways markets, it may lead to multiple consecutive position openings/closings
📊 Requires Optimization - optimal parameters need to be selected for different instruments and timeframes
💡 Usage Recommendations
Backtest - test the strategy's performance on historical data
Optimize Parameters - select MA periods suitable for the specific trading instrument
Use Filters - add additional filters to confirm signals
Manage Risks - always use stop-loss and take-profit orders.
You can safely connect to the exchange via webhook and enjoy trading.
Good luck and profits to everyone!!

Daily Bias on 5 minutes Reversal StrategyThis strategy combines higher-timeframe bias (daily and 1-hour) with 5-minute reversal signals to identify intraday trades. It aims to capitalize on false breakouts of the previous day's high/low, with strict risk management (Strict position sizing, max risk cap, and R:R enforcement), Avoids Over-Trading (1 trade/day rule prevents chasing), SL buffer adapts to volatility.
#1. This strategy does not utilize indicators. We will use the daily (D) price range and look for breakout attempts and rejections at the extreme points on the lower time frame (1h). If rejection occurs, it establishes our bias (bullish or bearish). For final confirmation, we move to the 5-minute timeframe to observe attempts to retest that daily price range. If significant rejection occurs again, that becomes our entry point.
#2. When rejection occurs, the 1-hour candle may form a new extreme point (low/high). Therefore, we will no longer use the daily price range as our trade exit point but instead the new extreme level established after the breakout attempt and price rejection.
To prevent premature trade exits, we also add an SL buffer using ATR while still capping the maximum acceptable risk per trade (as a percentage). Take profit is calculated using a risk-to-reward ratio, with a default setting of 1.5x.
#3. Key Input Parameters
a. Timeframes :
1. Daily TF ((Anchor for daily high/low (default: D).)
2. 1H Bias TF (Bias confirmation timeframe (default: 60))
3. Execution TF (Entry signal timeframe (default: 5, should match chart).
b. Trade Management
1. SL Buffer ATR Multiplier (Buffer beyond swing low/high (default: 6.0))
2. Min ATR Threshold (Minimum buffer size (default: 1.0))
3. Risk Reward Ratio (TP distance multiplier (default: 1.5))
4. Max Risk Allowed (Max risk % of entry (default: 3.0%))
Lookback Bars for SL Bars for swing low/high (default: 60))
c. Break Thresholds
1. 1H Candle Break Threshold (ATR multiplier for 1H break (default: 0.75))
2. 5M Candle Break Threshold (ATR multiplier for 5M break (default: 0.5))

3Commas Multicoin Scalper PRO [SwissAlgo]Introduction
Are you tired of tracking dozens of cryptocurrency charts and placing orders manually on your Exchange?
The 3Commas Multicoin Scalper PRO is an automated trading system designed to simultaneously identify and execute potential trading setups on multiple cryptocurrencies on your preferred Exchange (Binance, Bybit, OKX, Gate.io, Bitget) via 3Commas integration.
It analyzes price action, volume, momentum, volatility, and trend patterns across 180+ USDT Perpetual coins divided into 17 crypto categories , providing real-time signals directly to your 3Commas bots for automated trade execution. This indicator aims to identify potential trend-following and contrarian setups in both bull and bear markets.
-------------------------------------
What it Does
The 3Commas Multicoin Scalper PRO is a technical analysis tool that monitors multiple cryptocurrency pairs simultaneously and connects with 3Commas for signal delivery and execution.
Here's how the strategy works:
🔶 Technical Analysis : Analyzes price action, volume, momentum, volatility, and trend patterns across multiple USDT Perpetual Futures contracts simultaneously.
🔶 Pattern Detection : Identifies specific candle patterns and technical confluences that suggest potential trading setups across all USDT.P contracts of the selected categories
🔶 Signal Generation : When technical criteria are met at bar close, the indicator creates deal-start signals for the relevant pairs.
🔶 3Commas Integration : Packages these signals and delivers them to 3Commas through TradingView alerts, allowing 3Commas bots to receive specific pair information ('Deal-Start' signals).
🔶 Category Management : Each TradingView alert monitors an entire category (approximately 11 pairs), allowing selective activation of different crypto categories.
🔶 Visual Feedback : Provides color-coded candles and backgrounds to visualize technical conditions, with optional pivot points and trend visualization.
Candle types:
Signals:
-------------------------------------
Quick Start Guide
1. Setup 3Commas Bots : Configure two DCA bots in 3Commas (All USDT pairs) - one for LONG positions and one for SHORT positions.
2. Define Trading Parameters : Set your budget for each trade and adjust your preferred sensitivity within the indicator settings.
3. Create Category Alerts : Set up one TradingView alert for each crypto category you want to trade.
That's it! Once configured, the system automatically sends signals to your 3Commas bots when predefined trading setups are detected across coins in your selected/activated categories. The indicator scans all coins at bar close (for example, every hour on the 1H timeframe) and triggers trade execution only for those showing technical confluences.
Important : The more categories you activate by setting TradingView alerts, the more signals your 3Commas bots will receive. Consider your total capital when enabling multiple categories. More details about the setup process are provided below (see paragraph "Detailed Setup & Configuration")
-------------------------------------
Built-in Backtesting
The 3Commas Multicoin Scalper PRO includes backtesting visualization for each coin. When viewing any USDT Perpetual pair on your chart, you can visualize how the strategy would have performed historically on that specific asset.
Color-coded candles and signal markers show past trading setups, helping you evaluate which coins responded best to the strategy. This built-in backtesting capability can support your selection of assets/categories to trade before deploying real capital.
As backtesting results are hypothetical and do not guarantee future performance, your research and analysis are essential for selecting the crypto categories/coins to trade.
The default strategy settings are: Start Capital 1.000$, leverage 25X, Commissions 0.1% (average Taker Fee on Exchanges for average users), Order Amount 200$ for Longs/150$ for Shorts, Slippage 4
-------------------------------------
Key Features
🔶 Multi-Exchange Support : Compatible with BINANCE, BYBIT, BITGET, GATEIO, and OKX USDT Perpetual markets (USDT.P)
🔶 Wide Asset Coverage : Simultaneously analyzes 180+ cryptocurrencies across 17 specialized crypto categories
🔶 Custom Category Option : Create your watchlist with up to 10 custom USDT Perpetual pairs
🔶 3Commas Integration : Seamlessly connects with 3Commas bots to automate trade entries and exits
🔶 Dual Strategy Approach : Identifies both "trend following" and "contrarian" potential setups
🔶 Confluence-Based Signals : Uses a combination of multiple technical factors - price spikes, price momentum, volume spikes, volume momentum, trend analysis, and volatility spikes - to generate potential trading setups
🔶 Risk Management : Adjustable sensitivity/risk levels, leverage settings, and budget allocation for each trade
🔶 Visual Indicators : Color-coded candles and trading signals provide visual feedback on market conditions
🔶 Trend Indication : Background colors showing ongoing uptrends/downtrends
🔶 Pivot Points & Daily Open : Optional display of pivot points and daily open price for additional context
🔶 Liquidity Analysis : Optional display of high/low liquidity timeframes throughout the trading week
🔶 Trade Control : Configurable limit for the maximum number of signals sent to 3Commas for execution (per bar close and category)
Available Exchanges
Categories
Custom Category
Trend following/contrarian signals
-------------------------------------
Methodology
The 3Commas Multicoin Scalper PRO utilizes a multi-faceted approach to identify potential trading setups:
1. Price Action Analysis : Detects abnormal price movements by comparing the current candle's range to historical averages and standard deviations, helping identify potential "pump and dump" scenarios or new-trends start
2. Price Momentum : Evaluates the relative strength of bullish vs. bearish price movements over time, indicating the build-up of buying or selling pressure.
3. Volume Analysis: Identifies unusual volume spikes by comparing current volume to historical averages, signaling strong market interest in a particular direction.
4. Volume Momentum : Measures the ratio of bullish to bearish volume, revealing the dominance of buyers or sellers over time.
5. Trend Analysis : Combines EMA slopes, RSI, and Stochastic RSI to determine overall trend direction and strength.
6. Volatility : Monitors the ATR (Average True Range) to detect periods of increased market volatility, which may indicate potential breakouts or reversals
7. Candle Wick Analysis : Evaluates upper and lower wick percentages to detect potential rejection patterns and reversals.
8. Pivot Point Analysis : Uses pivot points (PP, R1-R3, S1-S3) for identifying key support/resistance areas and potential breakout/breakdown levels.
9. Daily Open Reference: Analyzes price action relative to the daily open for potential setups related to price movement vs. the opening price
10. Market Timing/Liquidity : Evaluates high/low liquidity periods, specific days/times of heightened risk, and potential market manipulation timeframes.
11. Boost Factors : Applies additional weight to certain confluence patterns to adjust global scores
These factors are combined into a "Global Score" ranging from -1 to +1 , applied at bar close to the newly formed candles.
Scores above predefined thresholds (configurable via the Sensitivity Settings) indicate strong bullish or bearish conditions and trigger signals based on predefined patterns. The indicator then applies additional filters to generate specific "Trend Following" and "Contrarian" trading signals. The identified signals are packaged and sent to 3Commas for execution.
Pivot Points
Daily open
Market Trend
Liquidity patterns by weekday
-------------------------------------
Who This Strategy Is For?
The 3Commas Multicoin Scalper PRO may benefit:
Crypto Traders seeking to automate their trading across multiple coins simultaneously
3Commas Users looking to enhance their bot performance with advanced technical signals
Busy Traders who want to monitor many market opportunities without constant chart-watching
Multi-strategy traders interested in both trend-following and reversal trading approaches
Traders of Various Experience Levels from intermediate traders wanting to save time to advanced traders seeking to scale their operations
Perpetual Futures Traders on major exchanges (Binance, Bybit, OKX, Gate.io, Bitget)
Swing and Scalp Traders seeking to identify short to medium-term profit opportunities
-------------------------------------
Visual Indicators
The indicator provides visual feedback through:
1. Candlestick Colors :
* Lime: Strong bullish candle (High positive score)
* Blue: Moderate bullish candle (Medium positive score)
* Red: Strong bearish candle (High negative score)
* Purple: Moderate bearish candle (Medium negative score)
* Pale Green/Red: Mild bullish/bearish candle
2. Signal Markers :
* ↗: Trend Following Long signal
* ↘: Trend Following Short signal
* ⤴: Contrarian Long signal
* ⤵: Contrarian Short signal
3. Optional Elements :
* Pivot Points: Daily support/resistance levels (R1-R3, S1-S3, PP)
* Daily Open: Reference price level for the current trading day
* Trend Background: Color-coded background suggesting potential ongoing uptrend/downtrend
* Liquidity Highlighting: Background colors indicating typical high/low market liquidity periods
4. TradingView Strategy Plots and Backtesting Data : Standard performance metrics showing entry/exit points, equity curves, and trade statistics, based on the signals generated by the script.
-------------------------------------
Detailed Setup & Configuration
The indicator features a user-friendly input panel organized in sequential steps to guide you through the complete setup process. Tooltips for each step provide additional information to help you understand the actions required to get the strategy running.
Informative tables provide additional details and instructions for critical setup steps such as 3Commas bot configuration and TradingView alert creation (to activate trading on specific categories).
1. Choose Exchange, Crypto Category & Sensitivity
* Select your USDT Perpetual Exchange (BINANCE, BYBIT, BITGET, GATEIO, or OKX) - i.e. the same Exchange connected in your 3Commas account
* Browse and choose your preferred crypto category, or define your watchlist
* Choose from three sensitivity levels: Default, Aggressive, or Test Mode (test mode is designed to generate way more signals, a potentially helpful feature when you are testing the indicator and alerts)
2. Setup 3Commas Bots and integrate them with the algo
* Create both LONG and SHORT DCA Bots in 3Commas
* Configure bots to accept signals for 'All USDT Pairs' with "TradingView Custom Signal" as deal start condition
* Enter your Bot IDs and Email Token in the indicator settings
* Set a maximum budget for LONG and SHORT trades
* Choose whether to allow LONG trades, SHORT trades, or both, according to your preference and market analysis
* Set maximum trades per bar/category (i.e. the max. number of simultaneous signals that the algo may send to your 3Commas bots for execution at every bar close - every hour if you set the 1H timeframe)
* Access the detailed setup guide table for step-by-step 3Commas configuration instructions
3Commas integration
3. Choose Visuals
* Toggle various optional visual elements to add to the chart: category metrics, fired alerts, coin metrics, daily open, pivot points
* Select a color theme: Dark or Light
4. Activate Trading via Alerts
* Create TradingView alerts for each category you want to trade
* Set alert condition to "3Commas Multicoin Scalper" with "Any alert() function call"
* Set the content of the message filed to: {{Message}}, deleting the default content shown in this text field, to enable proper 3Commas integration (any other text than {{Message}}, would break the delivery trading signals from Tradingview to 3Commas)
* View the alerts setup instruction table for visual guidance on this critical step
Alerts
Fired Alerts
Important Configuration Notes
Ensure that the TradingView chart's exchange matches your selected exchange in the indicator settings and your 3Commas bot settings.
You must configure the same leverage in both the script and your 3Commas bots
Your 3Commas bots must be configured for All USDT pairs
You must enter the exact Bot IDs and Email Token from 3Commas (these remain confidential - no one, including us, has access to them)
If you activate multiple categories without sufficient capital, 3Commas will display " insufficient funds " errors - align your available capital with the number of categories you activate (each deal will use the budget amount specified in user inputs)
You are free to set your Take Profit % / trailing on 3Commas
We recommend not to use DCA orders (i.e. set the number of DCA orders at zero)
Legend of symbols
-------------------------------------
FAQs
General Questions
❓ Q: What is Global Score? A: The Global Score serves as a foundation for signal generation. When a candle's score exceeds certain thresholds (defined by your Risk Level setting), it becomes a candidate for signal generation. However, not all high-scoring candles generate trading signals - the indicator applies additional pattern recognition and contextual filters. For example, a strongly positive score (lime candle) in an established uptrend may trigger a "Trend Following" signal, while a strongly negative score (red candle) in a downtrend might generate a "Trend Following Short" signal. Similarly, contrarian signals are generated when specific reversal patterns occur alongside appropriate Global Score values, often involving wick analysis and pivot point interactions. This multi-layer approach helps filter out false positives and identify higher-probability trading setups.
❓ Q: What's the difference between "Trend following" and "Contrarian" signals in the script? A: "Trend Following" signals follow the identified trends while "Contrarian" signals anticipate potential trend reversals.
❓ Q: Why can't I configure all the parameters? A: We've designed the solution to be plug-and-play to prevent users from getting lost in endless configurations. The preset values have been tested against their trade-offs in terms of financial performance, average trade duration, and risk levels.
❓ Q: Why don't I see any signals on my chart? A: Make sure you're viewing a USDT Perpetual pair from your selected exchange that belongs to the crypto category you've chosen to analyze. For example, if you've selected the "Top Major Coins" category with Binance as your exchange, you need to view a chart of one of those specific pairs (like BINANCE:BTCUSDT.P) to see signals. If you switch exchanges, for example from Binance to Bybit, you need to pull a Bybit pair on the chart to see backtesting data and signals.
❓ Q: Does this indicator guarantee profits? A: No. Trading cryptocurrencies involves significant risk, and past performance is not indicative of future results. This indicator is a tool to help you identify potential trading setups, but it does not and cannot guarantee profits.
❓ Q: Does this indicator repaint or use lookahead bias? A: No. All trading signals generated by this indicator are based only on completed price data and do not repaint. The system is designed to ensure that backtesting results reflect as closely as possible what you should experience in live trading.
While reference levels like pivot points are kept stable throughout the day using lookahead on, the actual buy and sell signals are calculated using only historical data (lookahead off) that would have been available at that moment in time. This ensures reliability and consistency between backtesting and real-time trading performance.
Technical Setup
❓ Q: What exchanges are supported? A: The strategy supports BINANCE, BYBIT, BITGET, GATEIO, and OKX USDT Perpetual markets (i.e. all the Exchanges you can connect to your 3Commas account for USDT Perpetual trading, excluding Coinbase Perpetual that offers UDSC pairs, instead of USDT).
❓ Q: What timeframe should I use? A: The indicator is optimized for the 1-hour (1H) timeframe but may run on any timeframe.
❓ Q: How many coins can I trade at once? A: You can trade all coins within each selected category (up to 11 coins per category in standard categories). You can activate multiple categories by setting up multiple alerts.
❓ Q: How many alerts do I need to set up? A: You need to set up one alert for each crypto category you want to trade. For example, if you want to trade both the "Top Major Coins" and the "DeFi" categories, you'll need to create two separate alerts, one for each category. We recommend starting with one category, testing the results carefully, monitoring performance daily, and perhaps activating additional categories in a second stage.
❓ Q: Are there any specific risk management features built into the indicator? A: Yes, the indicator includes risk management features: adjustable maximum trades per hour/category, the ability to enable/disable long or short signals depending on market conditions, customizable trade size for both long and short positions, and different sensitivity/risk level settings.
❓ Q: What happens if 3Commas can't execute a signal? A: If 3Commas cannot execute a signal (due to insufficient funds, bot offline, etc.), the trade will be skipped. The indicator will continue sending signals for other valid setups, but it doesn't retry failed signals.
❓ Q: Can I run this indicator on multiple charts at once? A: Yes, but it's not necessary. The indicator analyzes all coins in your selected categories regardless of which chart you apply it to. For optimal resource usage, apply it to a single chart of a USDT Perpetual pair from your selected exchange. To stop trading a category delete the alert created for that category.
❓ Q: How frequently does the indicator scan for new signals? A: The indicator scans all coins in your selected categories at the close of each bar (every hour if you selected the 1H timeframe).
3Commas Integration
❓ Q: Do I need a 3Commas account? A: Yes, a 3Commas account with active DCA bots (both LONG and SHORT) is required for automated trade execution. A paid subscription is needed, as multipair Bots and multiple simultaneous deals are involved.
❓ Q: How do I set the leverage? A: Set the leverage identically in both the indicator settings and your 3Commas DCA bots (the max supported leverage is 50x). Always be careful about leverage, as it amplifies both profits and losses.
❓ Q: Where do I find my 3Commas Bot IDs and Email Token? A: Open your 3Commas DCA bot and scroll to the "Messages" section. You'll find the Bot ID and Email Token within any message (e.g., "Start Deal").
Display Settings
❓ Q: What does the Sensitivity setting do? A: It adjusts the sensitivity of signal generation. "Default" provides a balanced approach with moderate signal frequency. "Aggressive" lowers the thresholds for signal generation, potentially increasing trade frequency but may include more noise. "Test Mode" is the most sensitive setting, useful for testing alert configurations but not recommended for live trading. Higher risk levels may generate more signals but with potentially lower average quality, while lower risk levels produce fewer but potentially better signals.
❓ Q: What does "Show fired alerts" do? A: The "Show fired alerts" option displays a label on your chart showing which signals have been fired and sent to 3Commas during the most recent candle closes. This visual indicator helps you confirm that your alerts are working properly and shows which coins from your selected category have triggered signals. It's useful when setting up and testing the system, allowing you to verify that signals are being sent to 3Commas as expected and their frequency over time.
❓ Q: What does "Show coin/token metrics" do? A: This toggle displays detailed technical metrics for the specific coin/token currently shown on your chart. When enabled, it shows statistics for the last closed candle for that coin.
❓ Q: What does "Show most liquid days/times" do? A: This toggle displays color-coded background highlighting to indicate periods of varying market liquidity throughout the trading week. Green backgrounds show generally higher liquidity periods (typically weekday trading hours), yellow highlights potentially manipulative periods (often Sunday/Monday overnight), and gray indicates low liquidity periods (when major markets are closed or during late hours).
⚠️ Disclaimer
This indicator is for informational and educational purposes only and does not constitute financial advice. Trading cryptocurrencies involves significant risk, including the potential loss of all invested capital, and past performance is not indicative of future results.
Always conduct your own thorough research (DYOR) and understand the risks involved before making any trading decisions. Trading with leverage significantly amplifies both potential profits and losses - exercise extreme caution when using leverage and never risk more than you can afford to lose.
The Bot ID and Email Token information are transmitted directly from TradingView to 3Commas via secure connections. No third party or entity will ever have access to this data (including the Author). Do not share your 3Commas credentials with anyone.
This indicator is not affiliated with, endorsed by, or sponsored by TradingView or 3Commas.

Divergence IQ [TradingIQ]Hello Traders!
Introducing "Divergence IQ"
Divergence IQ lets traders identify divergences between price action and almost ANY TradingView technical indicator. This tool is designed to help you spot potential trend reversals and continuation patterns with a range of configurable features.
Features
Divergence Detection
Detects both regular and hidden divergences for bullish and bearish setups by comparing price movements with changes in the indicator.
Offers two detection methods: one based on classic pivot point analysis and another that provides immediate divergence signals.
Option to use closing prices for divergence detection, allowing you to choose the data that best fits your strategy.
Normalization Options:
Includes multiple normalization techniques such as robust scaling, rolling Z-score, rolling min-max, or no normalization at all.
Adjustable normalization window lets you customize the indicator to suit various market conditions.
Option to display the normalized indicator on the chart for clearer visual comparison.
Allows traders to take indicators that aren't oscillators, and convert them into an oscillator - allowing for better divergence detection.
Simulated Trade Management:
Integrates simulated trade entries and exits based on divergence signals to demonstrate potential trading outcomes.
Customizable exit strategies with options for ATR-based or percentage-based stop loss and profit target settings.
Automatically calculates key trade metrics such as profit percentage, win rate, profit factor, and total trade count.
Visual Enhancements and On-Chart Displays:
Color-coded signals differentiate between bullish, bearish, hidden bullish, and hidden bearish divergence setups.
On-chart labels, lines, and gradient flow visualizations clearly mark divergence signals, entry points, and exit levels.
Configurable settings let you choose whether to display divergence signals on the price chart or in a separate pane.
Performance Metrics Table:
A performance table dynamically displays important statistics like profit, win rate, profit factor, and number of trades.
This feature offers an at-a-glance assessment of how the divergence-based strategy is performing.
The image above shows Divergence IQ successfully identifying and trading a bullish divergence between an indicator and price action!
The image above shows Divergence IQ successfully identifying and trading a bearish divergence between an indicator and price action!
The image above shows Divergence IQ successfully identifying and trading a hidden bullish divergence between an indicator and price action!
The image above shows Divergence IQ successfully identifying and trading a hidden bearish divergence between an indicator and price action!
The performance table is designed to provide a clear summary of simulated trade results based on divergence setups. You can easily review key metrics to assess the strategy’s effectiveness over different time periods.
Customization and Adaptability
Divergence IQ offers a wide range of configurable settings to tailor the indicator to your personal trading approach. You can adjust the lookback and lookahead periods for pivot detection, select your preferred method for normalization, and modify trade exit parameters to manage risk according to your strategy. The tool’s clear visual elements and comprehensive performance metrics make it a useful addition to your technical analysis toolbox.
The image above shows Divergence IQ identifying divergences between price action and OBV with no normalization technique applied.
While traders can look for divergences between OBV and price, OBV doesn't naturally behave like an oscillator, with no definable upper and lower threshold, OBV can infinitely increase or decrease.
With Divergence IQ's ability to normalize any indicator, traders can normalize non-oscillator technical indicators such as OBV, CVD, MACD, or even a moving average.
In the image above, the "Robust Scaling" normalization technique is selected. Consequently, the output of OBV has changed and is now behaving similar to an oscillator-like technical indicator. This makes spotting divergences between the indicator and price easier and more appropriate.
The three normalization techniques included will change the indicator's final output to be more compatible with divergence detection.
This feature can be used with almost any technical indicator.
Stop Type
Traders can select between ATR based profit targets and stop losses, or percentage based profit targets and stop losses.
The image above shows options for the feature.
Divergence Detection Method
A natural pitfall of divergence trading is that it generally takes several bars to "confirm" a divergence. This makes trading the divergence complicated, because the entry at time of the divergence might look great; however, the divergence wasn't actually signaled until several bars later.
To circumvent this issue, Divergence IQ offers two divergence detection mechanisms.
Pivot Detection
Pivot detection mode is the same as almost every divergence indicator on TradingView. The Pivots High Low indicator is used to detect market/indicator highs and lows and, consequently, divergences.
This method generally finds the "best looking" divergences, but will always take additional time to confirm the divergence.
Immediate Detection
Immediate detection mode attempts to reduce lag between the divergence and its confirmation to as little as possible while avoiding repainting.
Immediate detection mode still uses the Pivots Detection model to find the first high/low of a divergence. However, the most recent high/low does not utilize the Pivot Detection model, and instead immediately looks for a divergence between price and an indicator.
Immediate Detection Mode will always signal a divergence one bar after it's occurred, and traders can set alerts in this mode to be alerted as soon as the divergence occurs.
TradingView Backtester Integration
Divergence IQ is fully compatible with the TradingView backtester!
Divergence IQ isn’t designed to be a “profitable strategy” for users to trade. Instead, the intention of including the backtester is to let users backtest divergence-based trading strategies between the asset on their chart and almost any technical indicator, and to see if divergences have any predictive utility in that market.
So while the backtester is available in Divergence IQ, it’s for users to personally figure out if they should consider a divergence an actionable insight, and not a solicitation that Divergence IQ is a profitable trading strategy. Divergence IQ should be thought of as a Divergence backtesting toolkit, not a full-feature trading strategy.
Strategy Properties Used For Backtest
Initial Capital: $1000 - a realistic amount of starting capital that will resonate with many traders
Amount Per Trade: 5% of equity - a realistic amount of capital to invest relative to portfolio size
Commission: 0.02% - a conservative amount of commission to pay for trade that is standard in crypto trading, and very high for other markets.
Slippage: 1 tick - appropriate for liquid markets, but must be increased in markets with low activity.
Once more, the backtester is meant for traders to personally figure out if divergences are actionable trading signals on the market they wish to trade with the indicator they wish to use.
And that's all!
If you have any cool features you think can benefit Divergence IQ - please feel free to share them!
Thank you so much TradingView community!

Bollinger Bands Reversal + IBS Strategy█ STRATEGY DESCRIPTION
The "Bollinger Bands Reversal Strategy" is a mean-reversion strategy designed to identify potential buying opportunities when the price deviates below the lower Bollinger Band and the Internal Bar Strength (IBS) indicates oversold conditions. It enters a long position when specific conditions are met and exits when the IBS indicates overbought conditions. This strategy is suitable for use on various timeframes.
█ WHAT ARE BOLLINGER BANDS?
Bollinger Bands consist of three lines:
- **Basis**: A Simple Moving Average (SMA) of the price over a specified period.
- **Upper Band**: The basis plus a multiple of the standard deviation of the price.
- **Lower Band**: The basis minus a multiple of the standard deviation of the price.
Bollinger Bands help identify periods of high volatility and potential reversal points.
█ WHAT IS INTERNAL BAR STRENGTH (IBS)?
Internal Bar Strength (IBS) is a measure of where the closing price is relative to the high and low of the bar. It is calculated as:
IBS = (Close - Low) / (High - Low)
A low IBS value (e.g., below 0.2) indicates that the close is near the low of the bar, suggesting oversold conditions. A high IBS value (e.g., above 0.8) indicates that the close is near the high of the bar, suggesting overbought conditions.
█ SIGNAL GENERATION
1. LONG ENTRY
A Buy Signal is triggered when:
The IBS value is below 0.2, indicating oversold conditions.
The close price is below the lower Bollinger Band.
The signal occurs within the specified time window (between `Start Time` and `End Time`).
2. EXIT CONDITION
A Sell Signal is generated when the IBS value exceeds 0.8, indicating overbought conditions. This prompts the strategy to exit the position.
█ ADDITIONAL SETTINGS
Length: The lookback period for calculating the Bollinger Bands. Default is 20.
Multiplier: The number of standard deviations used to calculate the upper and lower Bollinger Bands. Default is 2.0.
Start Time and End Time: The time window during which the strategy is allowed to execute trades.
█ PERFORMANCE OVERVIEW
This strategy is designed for mean-reverting markets and performs best when the price frequently deviates from the Bollinger Bands.
It is sensitive to oversold and overbought conditions, as indicated by the IBS, which helps to identify potential reversals.
Backtesting results should be analyzed to optimize the Length and Multiplier parameters for specific instruments.

Qullamaggie Breakout V2After publishing the Qullamaggie Breakout script and seeing that it had some decent results, I wanted to explore it a bit further. There were a few things I didn't like about that methodology that didn't really jive with the way I like to trade. So what I did was combined the Breakout Trend Follower strategy I had been using for entries with the Qullamaggie strategy for trailing stops once in profit. The results seem pretty good to me and an approach that fits my personality and something I can actually trade. Typically better profit than the Breakout Trend Follower by giving more room for your winners to run, while still protecting your entries by moving up the trailing stop until you are in profit, all while taking less trades, so that's great.
Everything is done with stop orders. So you set your buy stop at the recent swing high point and wait for a breakout. Once in a position you set your sell stop at the recent swing low point. The most recent swing high and low are shown on the chart for easy reference with the blue and orange horizontal lines. Once in a trade, trail your sell stop after a new swing low is registered (shown by the thicker orange stop line). Once you are in profit, leave that hard stop level there (the orange line will stay there helping you). Now, you wait for price to cross a Moving Average of your choosing (default is Daily 10 MA). Once the bar crosses that moving average, you move your stop to the low of that candle (shown by the blue stop line) and trail your stop along every crossing of the moving average until the trend changes and takes out your stop. So managing this trade is pretty easy...just wait for the stop lines to move and move your stop with them. It's a great way to trade when you can't be at your computer all the time because the stop orders take care of execution on both buy and sell side. If you use a daily timeframe for your moving averages (the default), you really only need to move stops around about once a day, so is a good part time trader's strategy in my opinion.
The best opportunities will come by scanning for stocks in the longer term timeframe of your moving averages. Wait for a consolidation on that timeframe so the anticipated breakout has some room to run. Once you've identified a good candidate, zoom in to your lower timeframe where the swing highs/lows will act as your entry and exit points, all while keeping the moving averages consistent between timeframes.
Hope you guys find it useful.
A few options available:
- Choose any timeframe for your moving averages, while using swing high/low points on intraday charts.
- Choose one of two moving averages shown for your trailing stops (default 10 and 20 MA).
- Choose to use the third moving average as a filter for keeping you out of trades that are below it (trading with the trend).
- Use the charts resolution candle or the moving average resolution candle for the moving average trailing stop.
- Only take trades where your buy level minus stop level is below a % of the Average Daily Range (ADR). This allows you to potentially have better risk/reward. I added a little table that shows the ADR of the stock/ticker as well as the range between the recent buy and sell levels (shown by the orange and blue horizontal lines) for easy reference.

D.Y Volume Swing Strategy📌 Summary of the Daniel.Yer Volume Strategy
This strategy is based on identifying the "opening volume peak" at the start of each trading day, using a user-defined sampling window.
After the sampling period ends, the strategy looks for breakouts above the daily high or below the daily low, provided they occur with a strong high-volume candle that meets the user-set threshold.
When a breakout appears in one direction, the strategy waits for an opposite-direction confirmation candle (Reversal Confirmation) and then enters a smart counter-breakout trade.
Each trade includes dynamic Stop-Loss and Take-Profit levels calculated from recent price structure, with the option to multiply stop distance according to user preference.
The strategy also gives full control over entering long only, short only, or both, as well as choosing whether trades occur exclusively from the high/low or without restrictions.
The strategy can be tested on any timeframe and evaluated across four trading directions:
✔ Buy from High
✔ Sell from High
✔ Buy from Low
✔ Sell from Low

EVS BTC V1Overview
The "EVS BTC V1" is a momentum-based trading strategy designed for Bitcoin (BTC) or similar volatile assets on TradingView. It combines Exponential Moving Averages (EMAs) for trend direction, volume confirmation to filter for strong moves, and an optional Relative Strength Index (RSI) filter to avoid overextended entries. The strategy uses a trailing stop for exits to lock in profits dynamically. It's set up for backtesting with an initial capital of $10,000, risking 10% of equity per trade, and accounting for 0.1% commissions.This is a crossover strategy: it goes long on bullish EMA crossovers with high volume (and RSI not overbought) and short on bearish crossunders (with high volume and RSI not oversold). It's overlayed on the main price chart for easy visualization.Key Parameters (User-Adjustable)Fast EMA Period: 9 (default) – Shorter-term trend line.
Slow EMA Period: 21 (default) – Longer-term trend line.
Volume Multiplier: 1.5 (default) – Requires volume to be 1.5x the 20-period average for signal validation.
Use RSI Filter?: Enabled (default) – Optional toggle to apply RSI conditions.
RSI Period: 14 (default), with overbought threshold at 70 and oversold at 30.
Trailing Stop Profit: 50 points (default) – Activates trailing once this profit level is hit.
Trailing Stop Offset: 20 points (default) – Distance from the high/low to trail the stop-loss.
Indicators UsedEMAs: 9-period (fast, blue line) and 21-period (slow, red line) on close prices.
Volume Filter: Compares current volume to a 20-period SMA; signals only trigger if volume exceeds the average by the multiplier (highlighted in yellow bars).
RSI: 14-period on close; plotted in purple on a sub-panel if enabled, with dashed horizontal lines at 70 (overbought) and 30 (oversold).
Entry RulesEntries are triggered only when all conditions align on a bar close:Direction
Conditions
Long (Buy)
- Fast EMA crosses over Slow EMA (bullish trend shift).
- Volume is "high" (> 1.5x 20-period avg).
- RSI < 70 (not overbought; skipped if filter disabled).
Short (Sell)
- Fast EMA crosses under Slow EMA (bearish trend shift).
- Volume is "high" (> 1.5x 20-period avg).
- RSI > 30 (not oversold; skipped if filter disabled).
On entry: Places a market order using 10% of current equity.
Alerts: Fires a one-time alert per bar (e.g., "Long Signal: EMA Crossover + High Volume!").
Exit RulesNo fixed take-profit or stop-loss on entry.
Uses a trailing stop for both long and short positions:Trails the stop-loss 20 points below the highest high (for longs) or 20 points above the lowest low (for shorts), but only activates after 50 points of unrealized profit.
This allows winners to run while protecting gains dynamically.
Positions close automatically on opposite signals or trailing stop hits (no pyramiding; only one position per direction at a time).
VisualizationMain Chart: Blue fast EMA and red slow EMA lines. Green background tint on long signals, red on short signals.
Volume Sub-Panel: Gray columns for normal volume, yellow for high-volume bars; zero line for reference.
RSI Sub-Panel (if enabled): Purple RSI line with overbought/oversold dashed lines.
Strengths and ConsiderationsStrengths: Simple, trend-following with volume to avoid weak signals; RSI adds mean-reversion protection; trailing stops suit trending markets like BTC.
Risks: Whipsaws in sideways markets (EMA crossovers can false-signal); volume filter may miss low-volume breakouts; trailing parameters (50/20 points) assume a specific price scale (e.g., BTC/USD in dollars—adjust for other pairs).
Best For: Higher timeframes (e.g., 1H or 4H) on volatile crypto pairs. Backtest on historical data to tune parameters.

LW Outside Day Strategy[SpeculationLab]This strategy is inspired by the “Outside Day” concept introduced by Larry Williams in Long-Term Secrets to Short-Term Trading, and has been extended with configurable risk management tools and realistic backtesting parameters.
Concept
The “Outside Day” is a classic price action pattern that reflects strong market rejection or continuation pressure.
An Outside Bar occurs when the current bar’s high exceeds the previous high and the low falls below the previous low.
A body-size filter ensures only significant candles are included.
Entry Logic
Buy setup: Price closes below the previous low (bullish rejection).
Sell setup: Price closes above the previous high (bearish rejection).
Only confirmed bars are used (no intrabar signals).
Stop-Loss Modes
Prev Low/High: Uses the previous swing point ± ATR-based buffer.
ATR: Dynamic stop based on Average True Range × multiplier.
Fixed Pips: User-defined fixed distance (for forex testing).
Take-Profit Modes
Prev High/Low (PHL): Exits near the opposite swing.
Risk-Reward (RR): Targets a user-defined multiple of the stop distance (default = 2 : 1).
Following Price Open (FPO): Exits on the next bar’s open if price opens in profit (used to test overnight price continuation).
Risk Management & Backtest Settings
Default risk per trade is set at 10% of account equity (user-adjustable).
Commission = 0.1% and slippage = 2 ticks are applied to simulate realistic conditions.
For reliable statistics, test on data that yields over 100 trades.
Suitable for daily and 4-hour timeframes across stocks, forex, and crypto markets.
Visual Elements
Green and red triangles show entry signals.
Stop-loss (red) and take-profit (green) reference lines are drawn for clarity.
Optional alerts notify when a valid setup forms.
Disclaimer
This script is for educational and research purposes only.
It does not constitute financial advice or guarantee profits.
Always backtest thoroughly and manage your own risk.
Enhancements over Classic Outside Bar Models
Adjustable stop and target logic with ATR and buffer multipliers.
“Following Price Open” exit logic for realistic day-end management.
Optimized to avoid repainting and bar-confirmation issues.
Built with realistic trading costs and position sizing.
策略逻辑
外包线识别
当日最高价高于前一日最高价,且当日最低价低于前一日最低价,即形成外包线。
同时过滤掉较小实体的 K 线,仅保留实体显著大于前一根的形态。
方向过滤
收盘价低于前一日最低价 → 视为买入信号。
收盘价高于前一日最高价 → 视为卖出信号。
止损设置(可选参数)
前低/高止损:以形态前低/前高为止损,带有缓冲倍数。
ATR 止损:根据平均波动率(ATR)动态调整。
固定点数止损:按照用户设定的点数作为止损范围。
止盈设置(可选参数)
前高/低止盈(PHL):以前高/前低为目标。
固定盈亏比(RR):根据用户设定的风险回报比自动计算。
隔夜开盘(FPO):若次日开盘价高于进场价(多单)或低于进场价(空单),则平仓。
信号标记
在图表中标注买入/卖出信号(三角形标记)。
绘制止损与目标位参考线。
使用说明
适用周期:建议用于 日线图(Daily)。
适用市场:股票、外汇、加密货币等各类市场均可。
提示:此策略为历史研究与学习用途,不构成投资建议。实际交易请结合自身风险管理。

BRT T3 for BTC 1h [STRATEGY]## 📊 BRT T3 Adaptive Strategy for BTC 1H
STRATEGY DESCRIPTION
Professional trading strategy based on the adaptive T3 (Tillson T3) indicator with dynamic length controlled by the Relative Strength Index (RSI) . The strategy is specifically designed for Bitcoin trading on the hourly timeframe and includes a comprehensive filter system to minimize false signals.
═════════════════════════════════════════
🔥 UNIQUE CODE FEATURES
1. RSI-Adaptive Architecture:
• Innovative Approach: Unlike standard MA strategies with fixed periods, our code dynamically adjusts the moving average length based on RSI
• Smart Formula: len = minLen + (maxLen - minLen) * (1 - RSI/100) - automatically accelerates response in extreme zones
• Result: Strategy adapts to market conditions without manual reconfiguration
2. Modified Ichimoku Cloud:
• Unique Calculation: Instead of classic high/low, uses ATR-based method
• Dynamic Levels: Cloud is built based on volatility, not fixed periods
• Advantage: More accurate trend determination in highly volatile cryptocurrency markets
3. Hybrid Signal System:
• Dual-mode Generation: Switch between classic MA crossovers and volatility band breakouts
• Multi-stage Confirmation: Optional signal verification across N forward bars
• Effect: 40-60% reduction in false signals compared to simple MA strategies
4. All-in-One Solution:
• 8 MA Types in One Code: The only strategy on TradingView with complete implementation of T3, EMA, SMA, WMA, VWMA, HMA, RMA, DEMA
• Custom Functions: All MAs calculated through custom functions supporting series int
• Versatility: One code replaces 8 different strategies
5. Intelligent Filtering:
Combination of 4 independent filters:
├── Volume Filter (dynamic multiplier)
├── Trend Filter (adaptive period)
├── ATR Filter (volatility)
└── Ichimoku Filter (cloud trend)
• Unique Logic: Each filter can work independently or in combination
• Master Switch: Single control for all filters
6. Advanced Risk Management:
• Smart Stops: SL/TP levels are stored in variables and not recalculated on every bar
• Slippage Protection: Checks both close and high/low for stop triggers
• Visualization: Dynamic display of levels only for active positions
7. Performance Optimization:
• Efficient Loops: Minimized calculations through intermediate result storage
• Conditional Visualization: Element rendering only when necessary
• Clean Code: Structured organization with clear logical block separation
═════════════════════════════════════════
💎 TECHNICAL INNOVATIONS
Adaptation Algorithm (exclusive development):
// Dynamic length based on RSI
rsi_scale = 1.0 - rsi / 100.0
len_adaptive = minLen + (maxLen - minLen) * rsi_scale
ATR-based Ichimoku (unique modification):
// Instead of classic (highest + lowest) / 2
// Using ATR for dynamic levels
upper := close < upper ? min(hl2 + atr*mult, upper ) : hl2 + atr*mult
lower := close > lower ? max(hl2 - atr*mult, lower ) : hl2 - atr*mult
Multi-MA Architecture (complete implementation):
• Each MA type has its own optimized function
• Support for series int for dynamic length
• Unified selection interface via switch statement
═════════════════════════════════════════
🎯 KEY FEATURES
• Adaptive System: Moving average length automatically adjusts based on RSI, providing quick response in trending movements and stability in sideways markets
• 8 Moving Average Types: T3, EMA, SMA, WMA, VWMA, HMA, RMA, DEMA - ability to choose the optimal type for different market conditions
• Multi-level Filtering:
- Volume Filter - signal confirmation with increased activity
- Trend Filter - trading in the direction of the main trend
- ATR Filter - accounting for market volatility
- Ichimoku Cloud - additional trend direction confirmation
• Professional Risk Management: Customizable stop-loss and take-profit levels
═════════════════════════════════════════
⚙️ HOW IT WORKS
1. Signal Generation:
• Original Mode: Classic MA crossover signals with lagged version
• Band Break Mode: Volatility band breakouts (based on standard deviation)
2. RSI Adaptation:
• High RSI (overbought) → uses short MA length for quick response
• Low RSI (oversold) → uses long MA for noise smoothing
• Adaptation range is configured by Min/Max length parameters
3. Filter System:
• Each filter can be enabled/disabled independently
• Signal is generated only when passing all active filters
• Ichimoku filter blocks counter-trend trades
═════════════════════════════════════════
📈 STRATEGY PARAMETERS
Main Settings:
• Strategy Type: Long Only / Short Only / Both
• Data Source: Close, Open, High, Low, HL2, HLC3, OHLC4
RSI Settings:
• RSI Length: Calculation period (default 14)
• RSI Smoothing: Smoothing to reduce noise
T3/MA Settings:
• Min/Max Length: Adaptive length range (5-50)
• Volume Factor: T3 smoothing coefficient (0.7)
• MA Type: Moving average type selection
Filters:
• Volume Filter: Volume multiplier (1.5x average)
• Trend Filter: Trend MA period (200)
• ATR Filter: Minimum volatility for entry
• Ichimoku Filter: Cloud for trend determination
Risk Management:
• Stop Loss: Percentage from entry price (1.2%)
• Take Profit: Percentage from entry price (5.9%)
• Position Size: 50,000 USDT (effective leverage 5x)
═════════════════════════════════════════
💡 USAGE RECOMMENDATIONS
Optimal Conditions:
• Timeframe: 1H (developed and optimized)
• Instrument: BTC/USDT and other liquid cryptocurrencies
• Market Conditions: Trending and moderately volatile markets
Customize to Your Style:
1. Conservative: Increase signal confirmation period, enable all filters
2. Aggressive: Reduce filters, use Band Break mode
3. Scalping: Decrease Min/Max length, disable trend filter
═════════════════════════════════════════
📊 VISUALIZATION
Strategy displays:
• Main MA Line - changes color depending on direction
• Lag Line - for visualizing crossover moment
• Volatility Bands - upper and lower boundaries
• Trend MA - orange line (200 periods)
• SL/TP Levels - red and green lines for open positions
═════════════════════════════════════════
🔔 ALERTS
Strategy supports alert configuration for:
• Long position entry signals
• Short position entry signals
• Position exit signals
• Ichimoku line crossings
═════════════════════════════════════════
⚠️ RISK WARNING
IMPORTANT NOTICE: Trading in financial markets involves substantial risk of capital loss. Past performance presented in this strategy is based solely on historical data and under no circumstances constitutes a guarantee of future returns.
The strategy author is not responsible for:
• Any direct or indirect financial losses resulting from the use of this strategy
• Trading decisions made based on strategy signals
• Interpretation of backtesting results as a forecast of future performance
This strategy is provided exclusively for educational and research purposes. Backtesting results are affected by numerous factors including but not limited to: slippage, spread, commissions, market liquidity, and technical failures.
Before using the strategy in live trading:
• Conduct your own testing on a demo account
• Ensure understanding of all parameters and logic
• Only use funds you can afford to lose
• Consider consulting with a qualified financial advisor
DISCLAIMER: By using this strategy, you acknowledge and accept all risks associated with financial market trading and confirm that the author does not provide investment advice and bears no fiduciary responsibility to users.
═════════════════════════════════════════
🛠 TECHNICAL SUPPORT
For questions about setup and optimization:
• Leave comments under the publication
• Follow strategy updates
• Study the code for deep understanding of logic
═════════════════════════════════════════
📝 VERSION AND UPDATES
Version: 1.0.0
Pine Script: v6
Last Updated: 2025
Changelog:
• Added support for 8 MA types
• Integrated Ichimoku Cloud filter
• Optimized risk management system
• Improved signal visualization
═════════════════════════════════════════
© 2025 BRT Trading Systems
Strategy is protected by copyright. Commercial use without author's permission is prohibited.
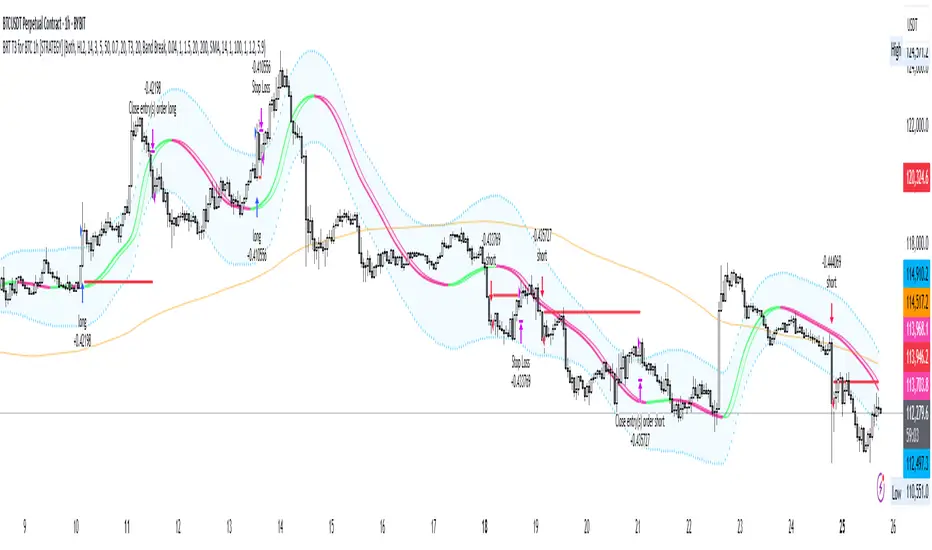
The Barking Rat LiteMomentum & FVG Reversion Strategy
The Barking Rat Lite is a disciplined, short-term mean-reversion strategy that combines RSI momentum filtering, EMA bands, and Fair Value Gap (FVG) detection to identify short-term reversal points. Designed for practical use on volatile markets, it focuses on precise entries and ATR-based take profit management to balance opportunity and risk.
Core Concept
This strategy seeks potential reversals when short-term price action shows exhaustion outside an EMA band, confirmed by momentum and FVG signals:
EMA Bands:
Parameters used: A 20-period EMA (fast) and 100-period EMA (slow).
Why chosen:
- The 20 EMA is sensitive to short-term moves and reflects immediate momentum.
- The 100 EMA provides a slower, structural anchor.
When price trades outside both bands, it often signals overextension relative to both short-term and medium-term trends.
Application in strategy:
- Long entries are only considered when price dips below both EMAs, identifying potential undervaluation.
- Short entries are only considered when price rises above both EMAs, identifying potential overvaluation.
This dual-band filter avoids counter-trend signals that would occur if only a single EMA was used, making entries more selective..
Fair Value Gap Detection (FVG):
Parameters used: The script checks for dislocations using a 12-bar lookback (i.e. comparing current highs/lows with values 12 candles back).
Why chosen:
- A 12-bar displacement highlights significant inefficiencies in price structure while filtering out micro-gaps that appear every few bars in high-volatility markets.
- By aligning FVG signals with candle direction (bullish = close > open, bearish = close < open), the strategy avoids random gaps and instead targets ones that suggest exhaustion.
Application in strategy:
- Bullish FVGs form when earlier lows sit above current highs, hinting at downward over-extension.
- Bearish FVGs form when earlier highs sit below current lows, hinting at upward over-extension.
This gives the strategy a structural filter beyond simple oscillators, ensuring signals have price-dislocation context.
RSI Momentum Filter:
Parameters used: 14-period RSI with thresholds of 80 (overbought) and 20 (oversold).
Why chosen:
- RSI(14) is a widely recognized momentum measure that balances responsiveness with stability.
- The thresholds are intentionally extreme (80/20 vs. the more common 70/30), so the strategy only engages at genuine exhaustion points rather than frequent minor corrections.
Application in strategy:
- Longs trigger when RSI < 20, suggesting oversold exhaustion.
- Shorts trigger when RSI > 80, suggesting overbought exhaustion.
This ensures entries are not just technically valid but also backed by momentum extremes, raising conviction.
ATR-Based Take Profit:
Parameters used: 14-period ATR, with a default multiplier of 4.
Why chosen:
- ATR(14) reflects the prevailing volatility environment without reacting too much to outliers.
- A multiplier of 4 is a pragmatic compromise: wide enough to let trades breathe in volatile conditions, but tight enough to enforce disciplined exits before mean reversion fades.
Application in strategy:
- At entry, a fixed target is set = Entry Price ± (ATR × 4).
- This target scales automatically with volatility: narrower in calm periods, wider in explosive markets.
By avoiding discretionary exits, the system maintains rule-based discipline.
Visual Signals on Chart
Blue “▲” below candle: Potential long entry
Orange/Yellow “▼” above candle: Potential short entry
Green “✔️”: Trade closed at ATR take profit
Blue (20 EMA) & Orange (100 EMA) lines: Dynamic channel reference
⚙️Strategy report properties
Position size: 25% equity per trade
Initial capital: 10,000.00 USDT
Pyramiding: 10 entries per direction
Slippage: 2 ticks
Commission: 0.055% per side
Backtest timeframe: 1-minute
Backtest instrument: HYPEUSDT
Backtesting range: Jul 28, 2025 — Aug 17, 2025
Note on Sample Size:
You’ll notice the report displays fewer than the ideal 100 trades in the strategy report above. This is intentional. The goal of the script is to isolate high-quality, short-term reversal opportunities while filtering out low-conviction setups. This means that the Barking Rat Lite strategy is very selective, filtering out over 90% of market noise. The brief timeframe shown in the strategy report here illustrates its filtering logic over a short window — not its full capabilities. As a result, even on lower timeframes like the 1-minute chart, signals are deliberately sparse — each one must pass all criteria before triggering.
For a larger dataset:
Once the strategy is applied to your chart, users are encouraged to expand the lookback range or apply the strategy to other volatile pairs to view a full sample.
💡Why 25% Equity Per Trade?
While it's always best to size positions based on personal risk tolerance, we defaulted to 25% equity per trade in the backtesting data — and here’s why:
Backtests using this sizing show manageable drawdowns even under volatile periods.
The strategy generates a sizeable number of trades, reducing reliance on a single outcome.
Combined with conservative filters, the 25% setting offers a balance between aggression and control.
Users are strongly encouraged to customize this to suit their risk profile.
What makes Barking Rat Lite valuable
Combines multiple layers of confirmation: EMA bands + FVG + RSI
Adaptive to volatility: ATR-based exits scale with market conditions
Clear, actionable visuals: Easy to monitor and manage trades
